Power BI Visual Export Tool Usage Guide
Export visuals from Power BI to PowerPoint, PDF, and Excel
5 minutes to read | Posted: 04 June 2019

Power BI Export Tool Features
- Export Power BI visuals and pages to PPT and PDF.
- Export Power BI visuals and their summarized data to Excel.
- Export visuals as high-resolution images.
- Export from multiple reports and workspaces (including My Workspace).
- Export certified and non-certified custom visuals (including R visuals).
- Apply filters and slicers to exports.
- Save custom export configuration for future use.
- Preview PPT and PDF and layouts; reposition visuals before exporting.
- Supports custom PPT templates including custom headers and footers.
- Supports many slide layouts.
Using Power BI Visual Export Tool
-
Open the Power BI Export Tool. Log into the Office 365 account that contains the Power BI report that you want to export (Figure 1). After logging in, a list of accessible workspaces will load in the left navigation pane.
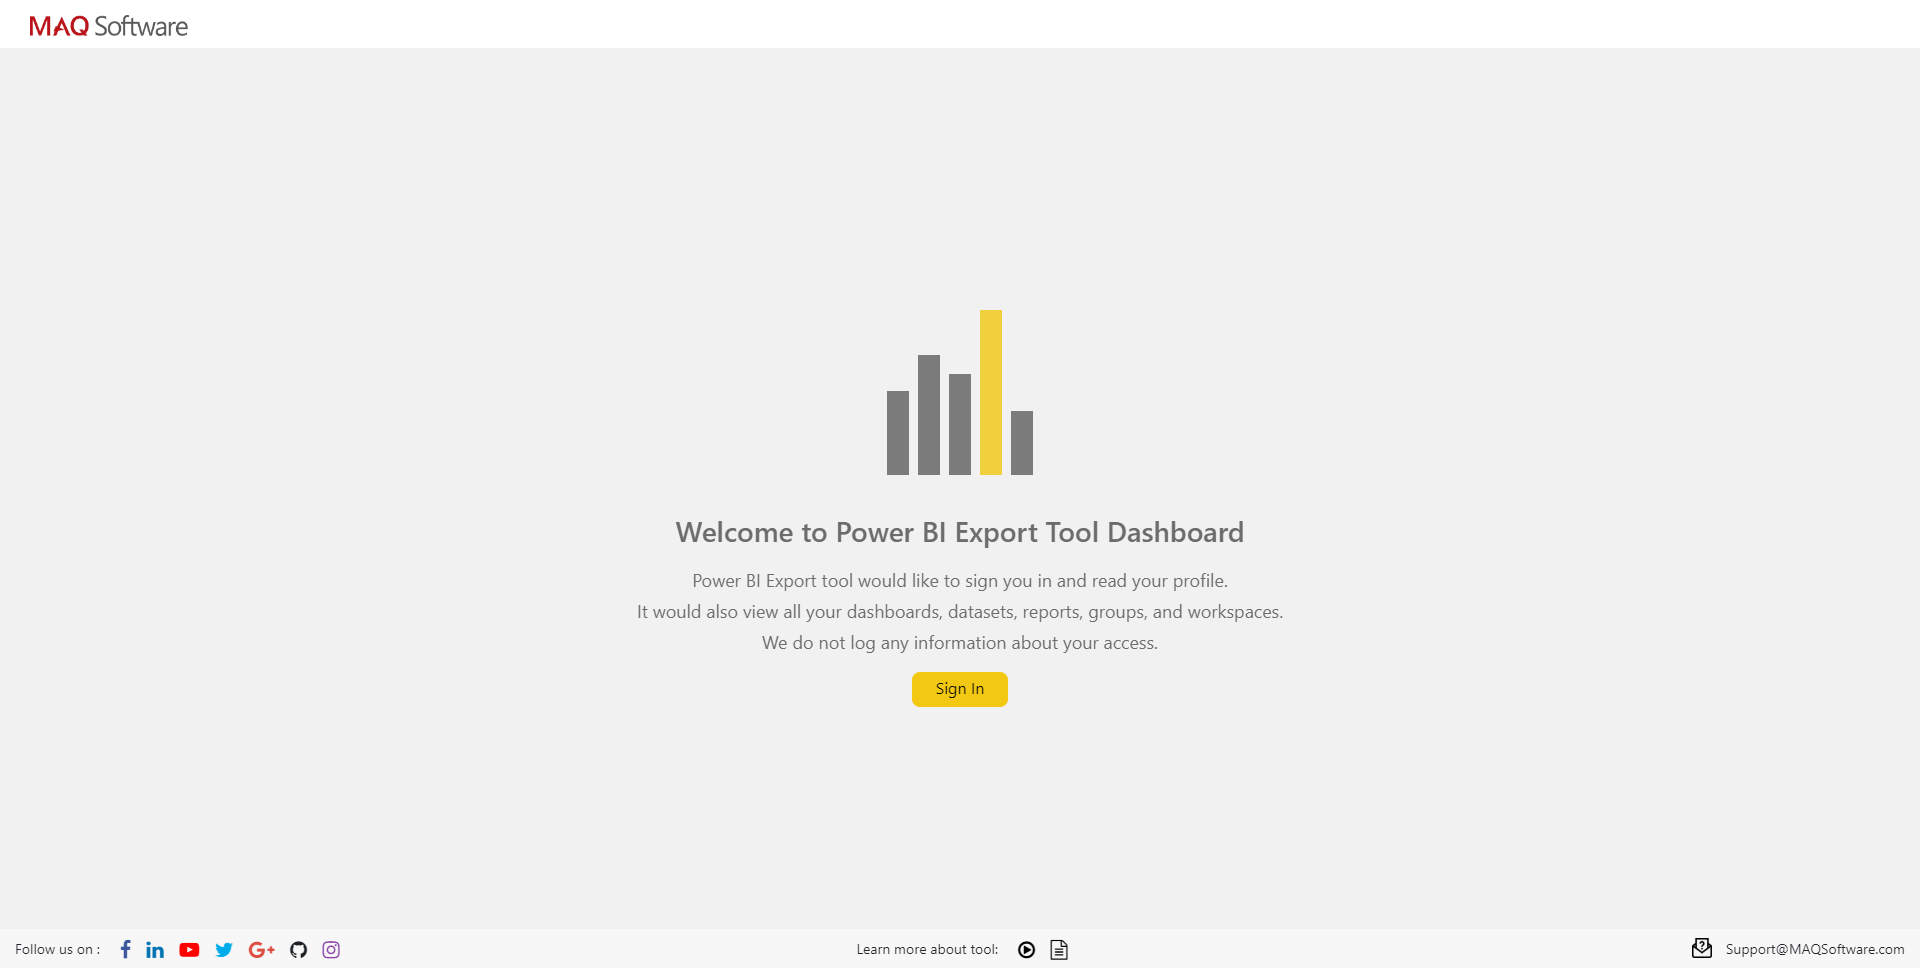 Figure 1: Landing page
-
Select an export mode (PPT, PDF, or Excel) (Figure 2). You can change the export mode at any time. If you have a custom slide configuration that you have previously generated using Power BI Export Tool, you can import it during this step. Note: although the export process is identical for all three modes, Excel mode does not support custom slide configuration.
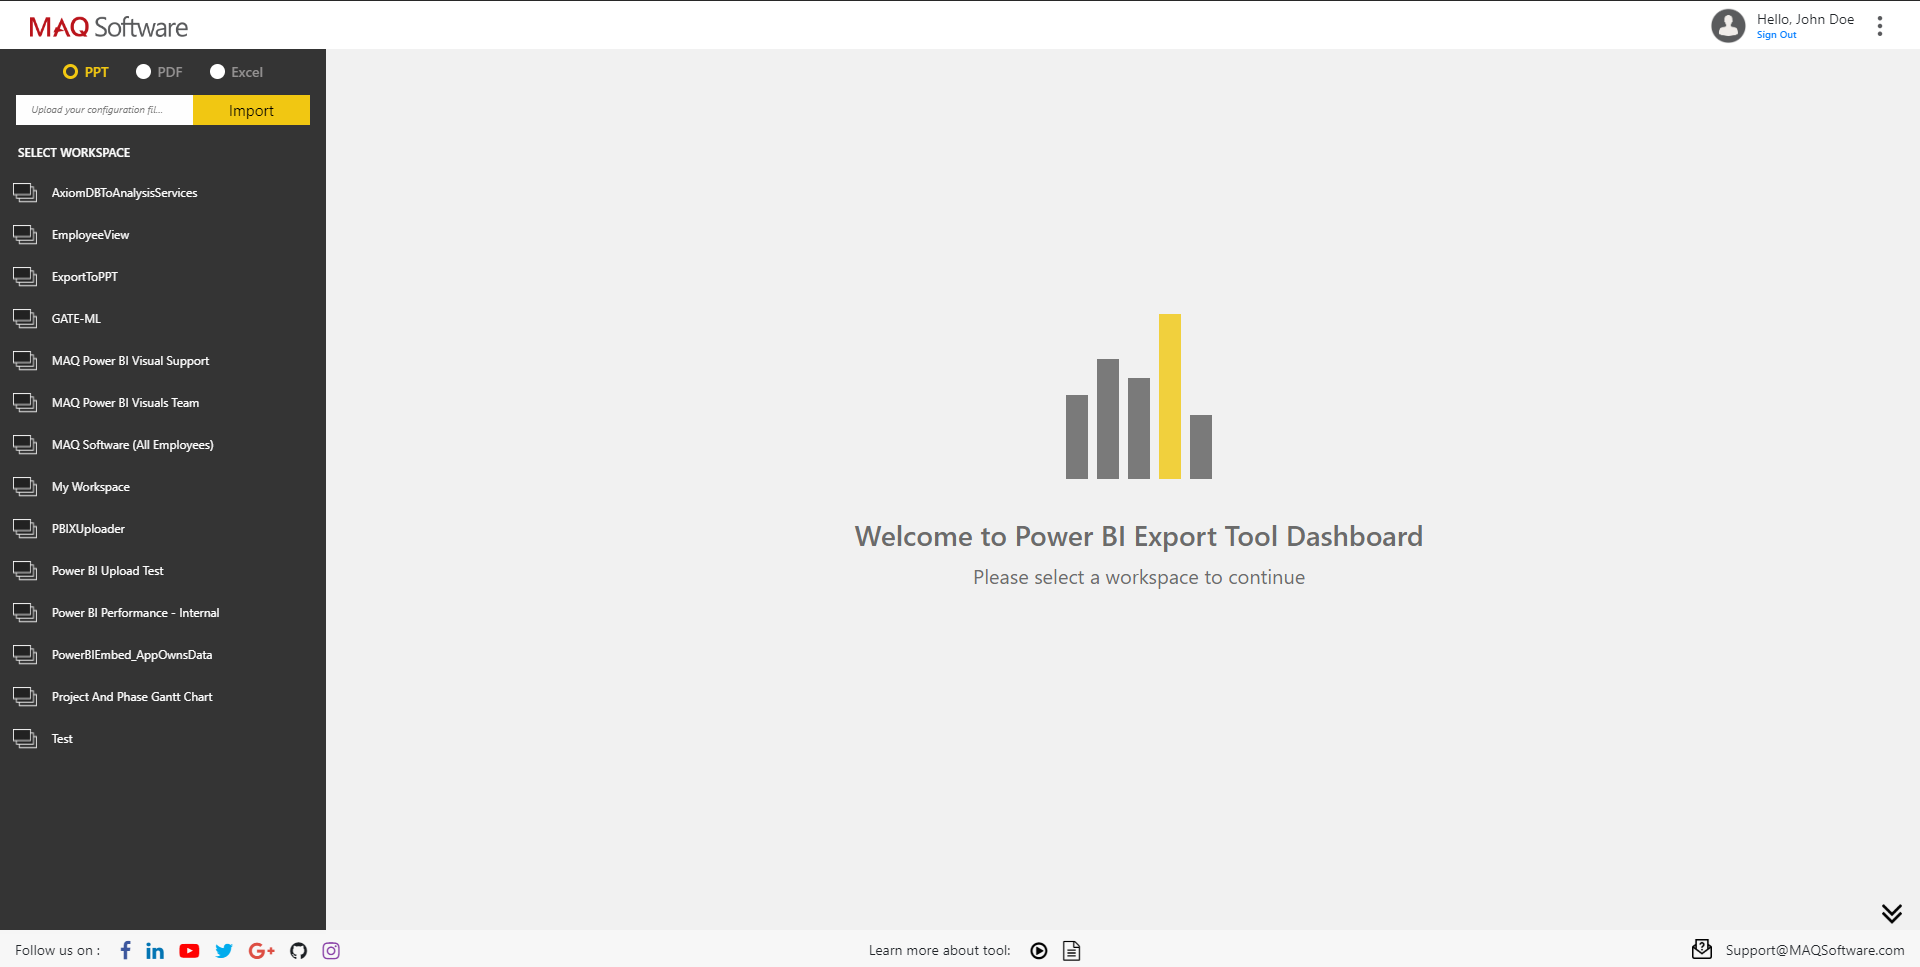 Figure 2: Export modes (PPT, PDF, and Excel)
-
Select a workspace and a report from the left navigation pane. You can also select a report from the “My Workspace” section or any other workspace you have access to. After you click the report name, the default report page automatically loads and all the visuals from the page will display on the canvas. Additionally, a slide navigation pane appears (Figure 3).
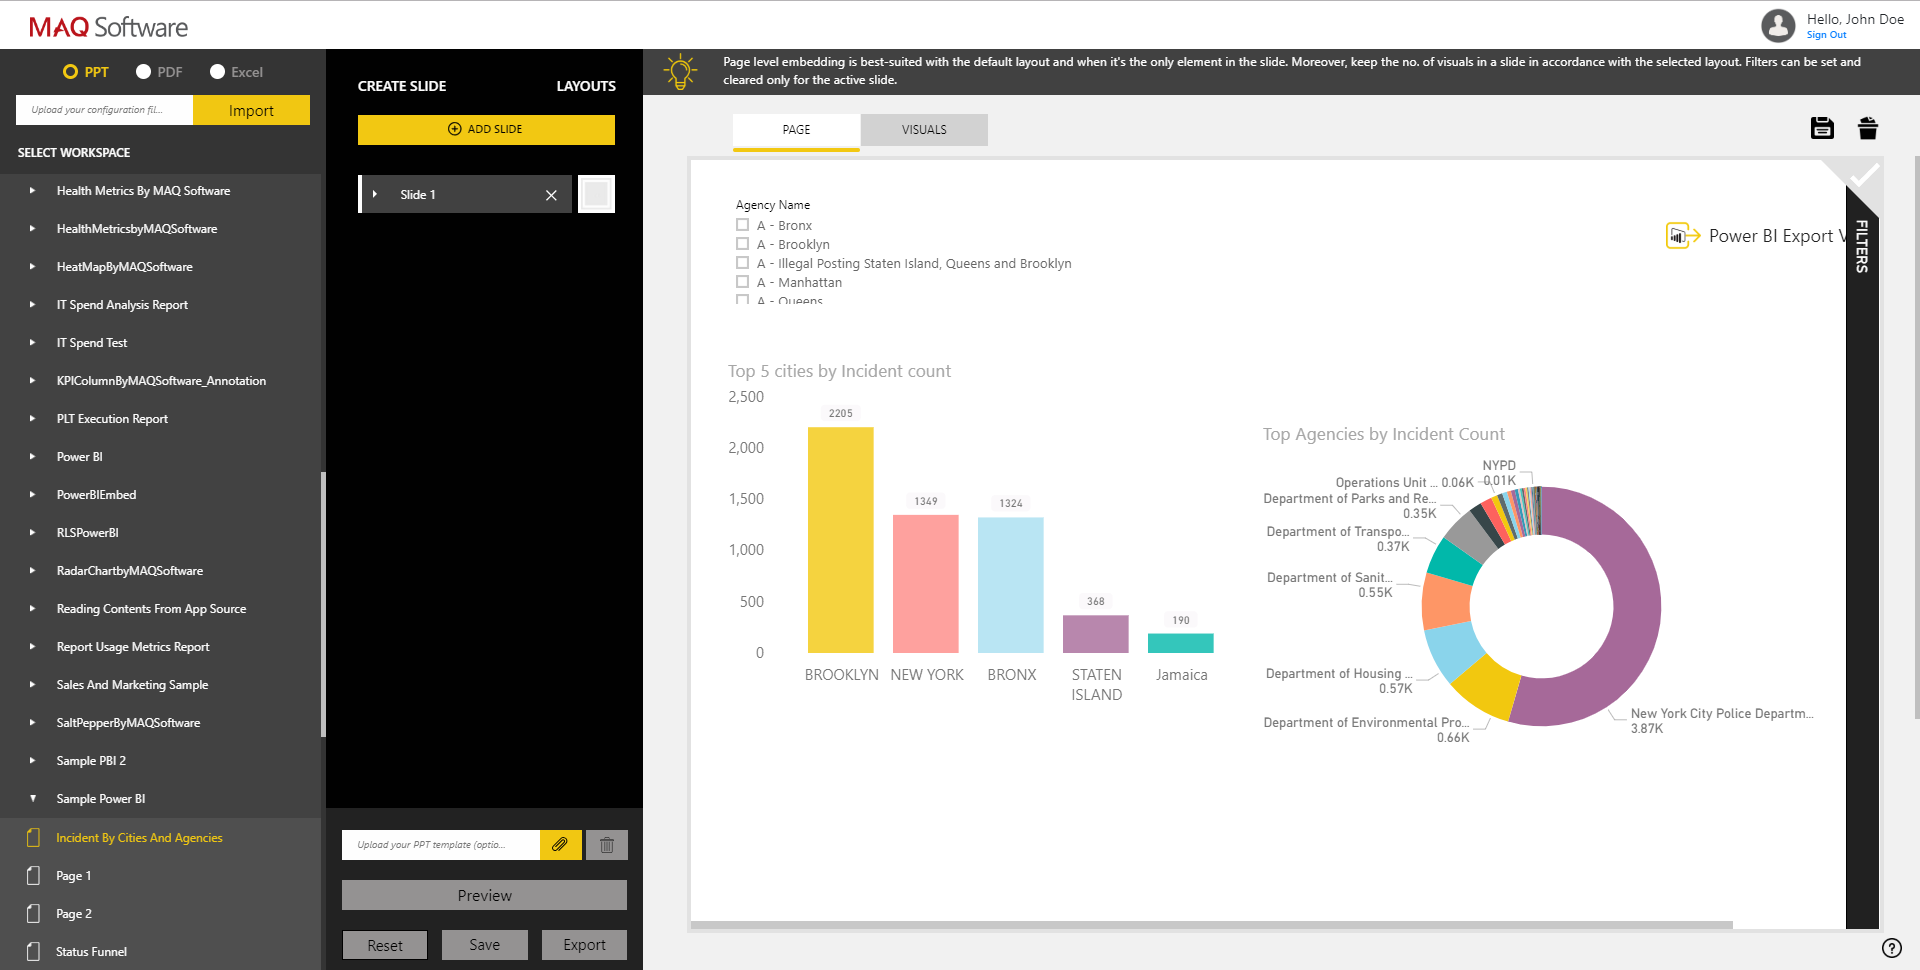 Figure 3: Report navigation and PowerPoint slide navigation panes
-
To create a custom slide, choose the page or visuals from the canvas you want to export. You can add one or more visuals to the same slide. You can create additional slides by clicking the Add Slide button in the slide navigation pane (Figure 4). To select visuals and pages from other reports, use the left navigation pane. The top toolbar includes helpful tips regarding report page embedding.
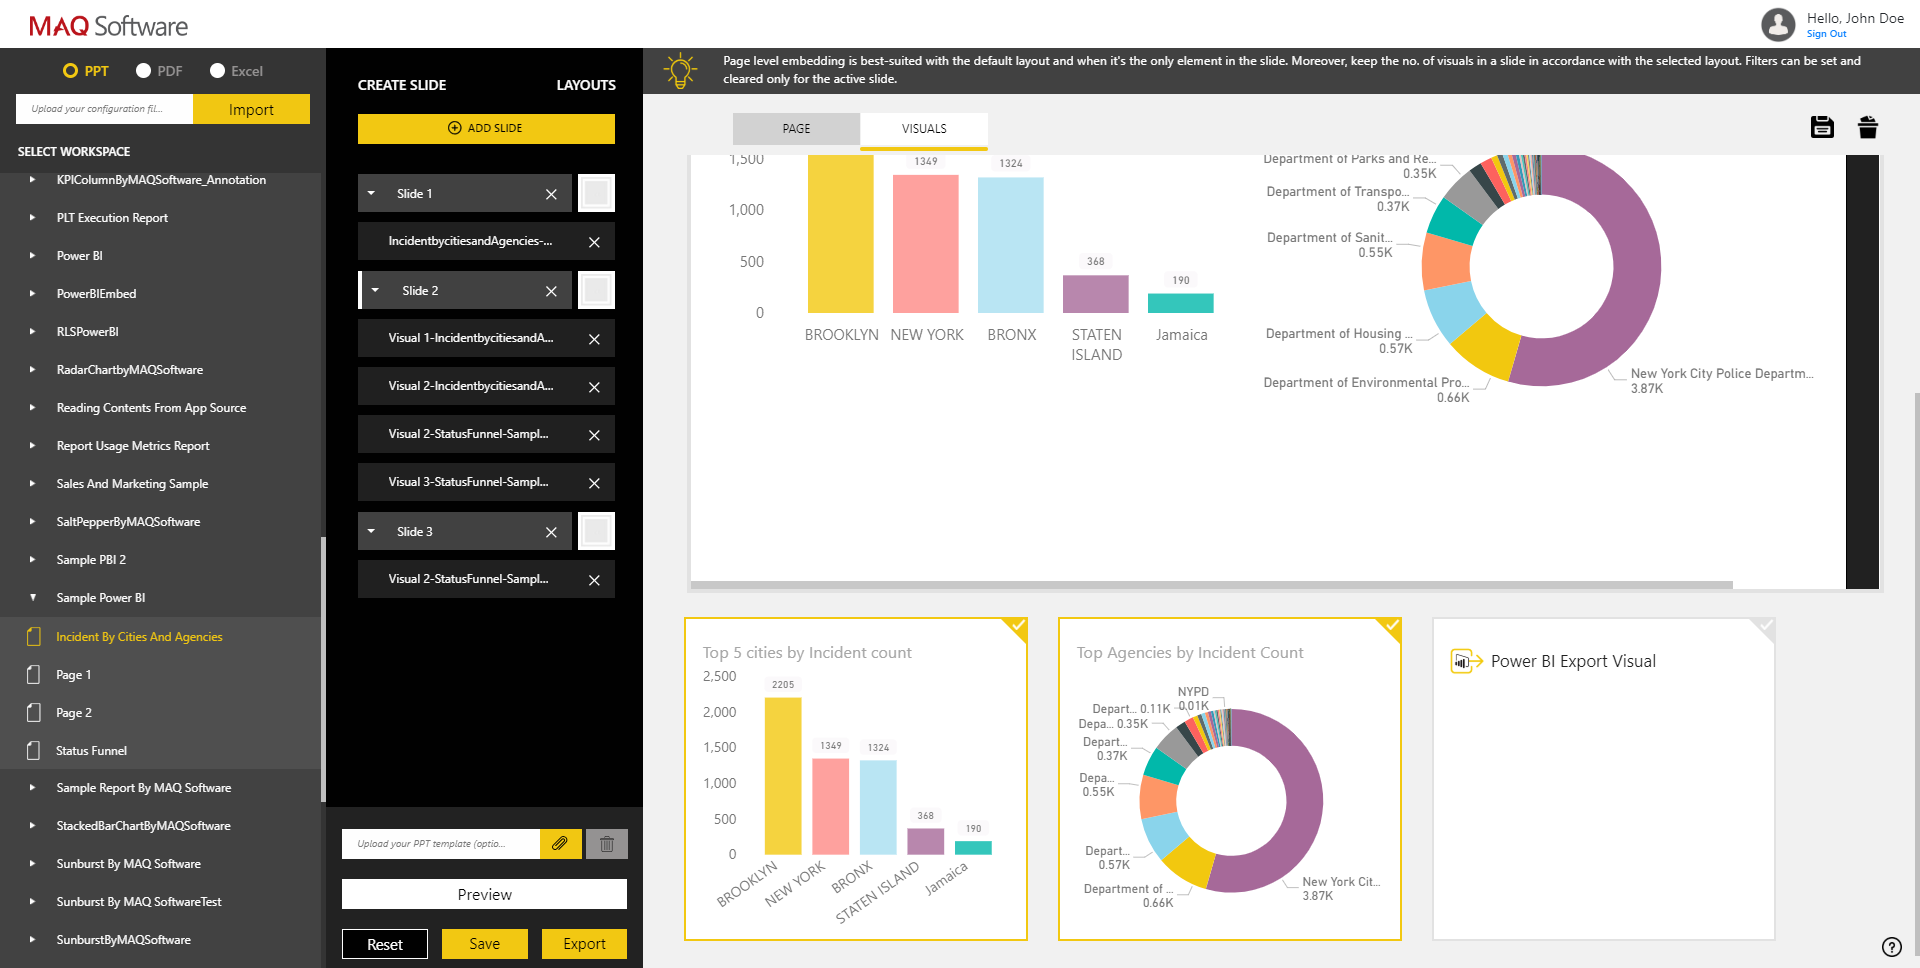 Figure 4: Creating multiple slides
-
Apply the desired slicers, filters, or both to the appropriate pages and save the applied filters (Figure 5). Filters will then be applied to the specified images in the PPT export. Please note, applied filters are persistent to a slide context only.
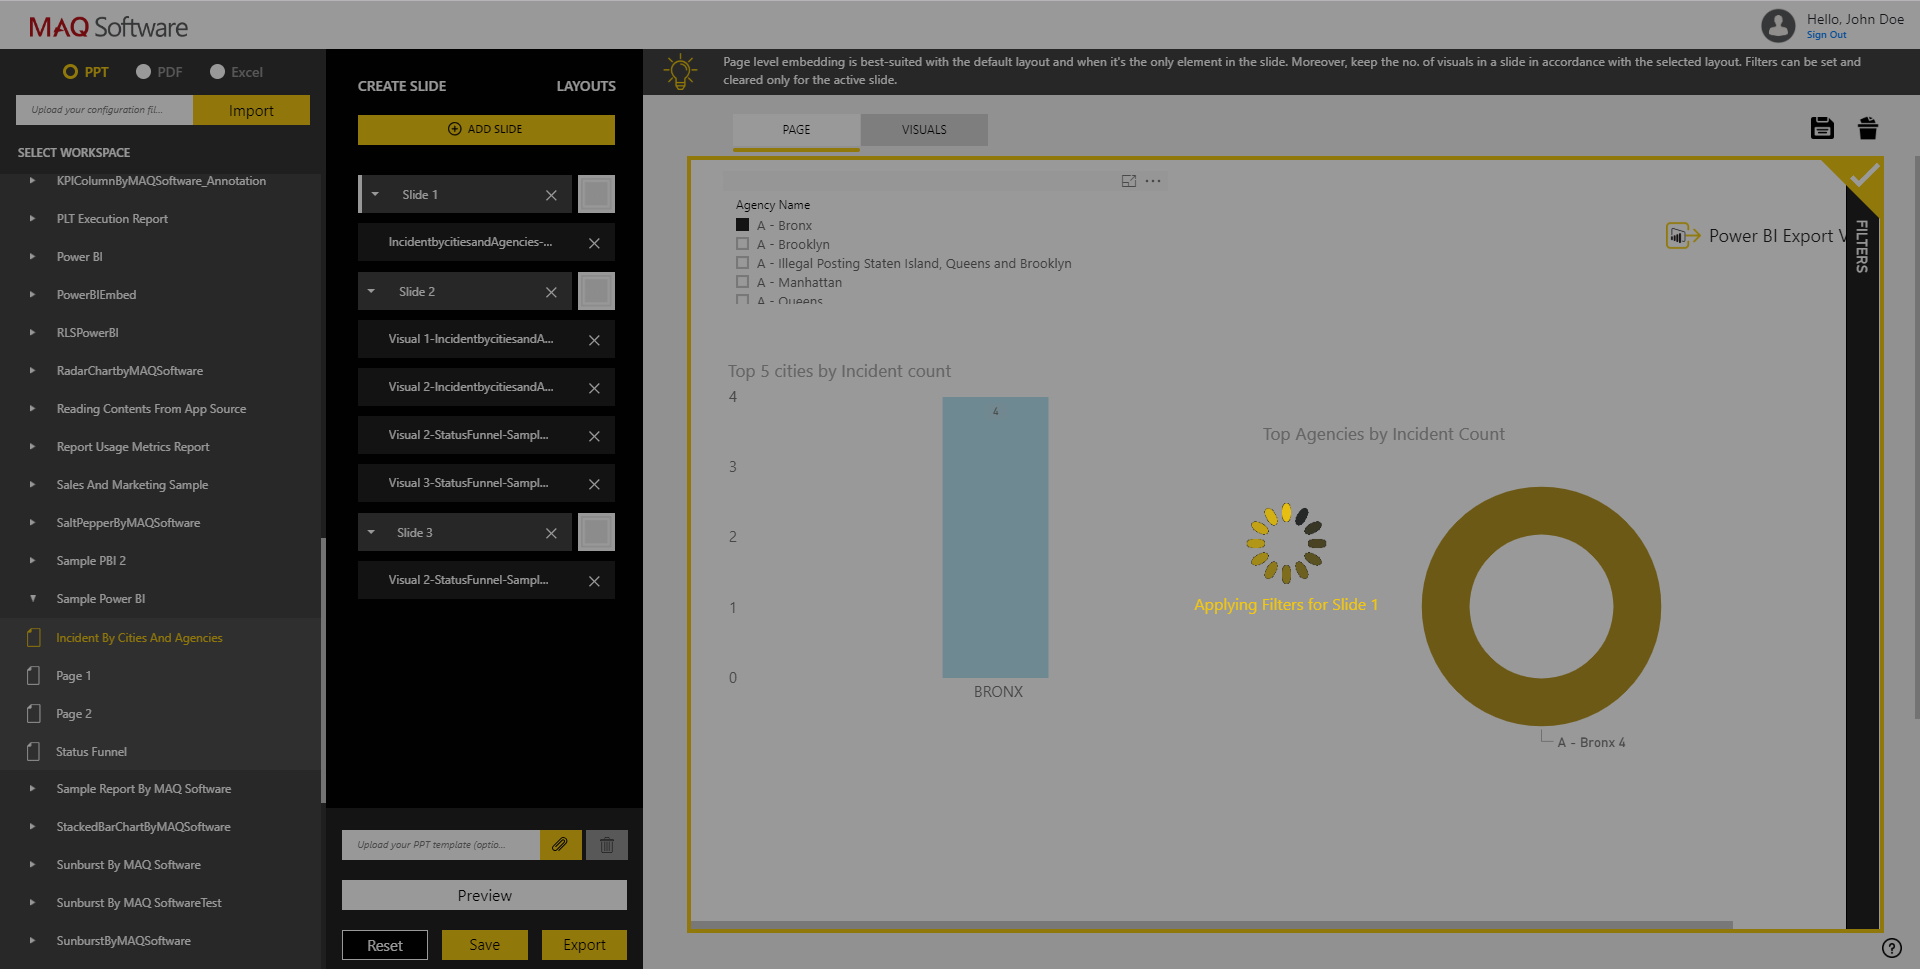 Figure 5: Applying filters for Slide 1
-
When you have finished creating your slides, you can export to the default template or select a custom PowerPoint template (only in PPT mode). If you select a custom template, Power BI Export Tool retains the template’s header and footer and places the exported images into the pre-determined image placeholders. If you select the default template, you can choose from various slide layouts (Figure 6).
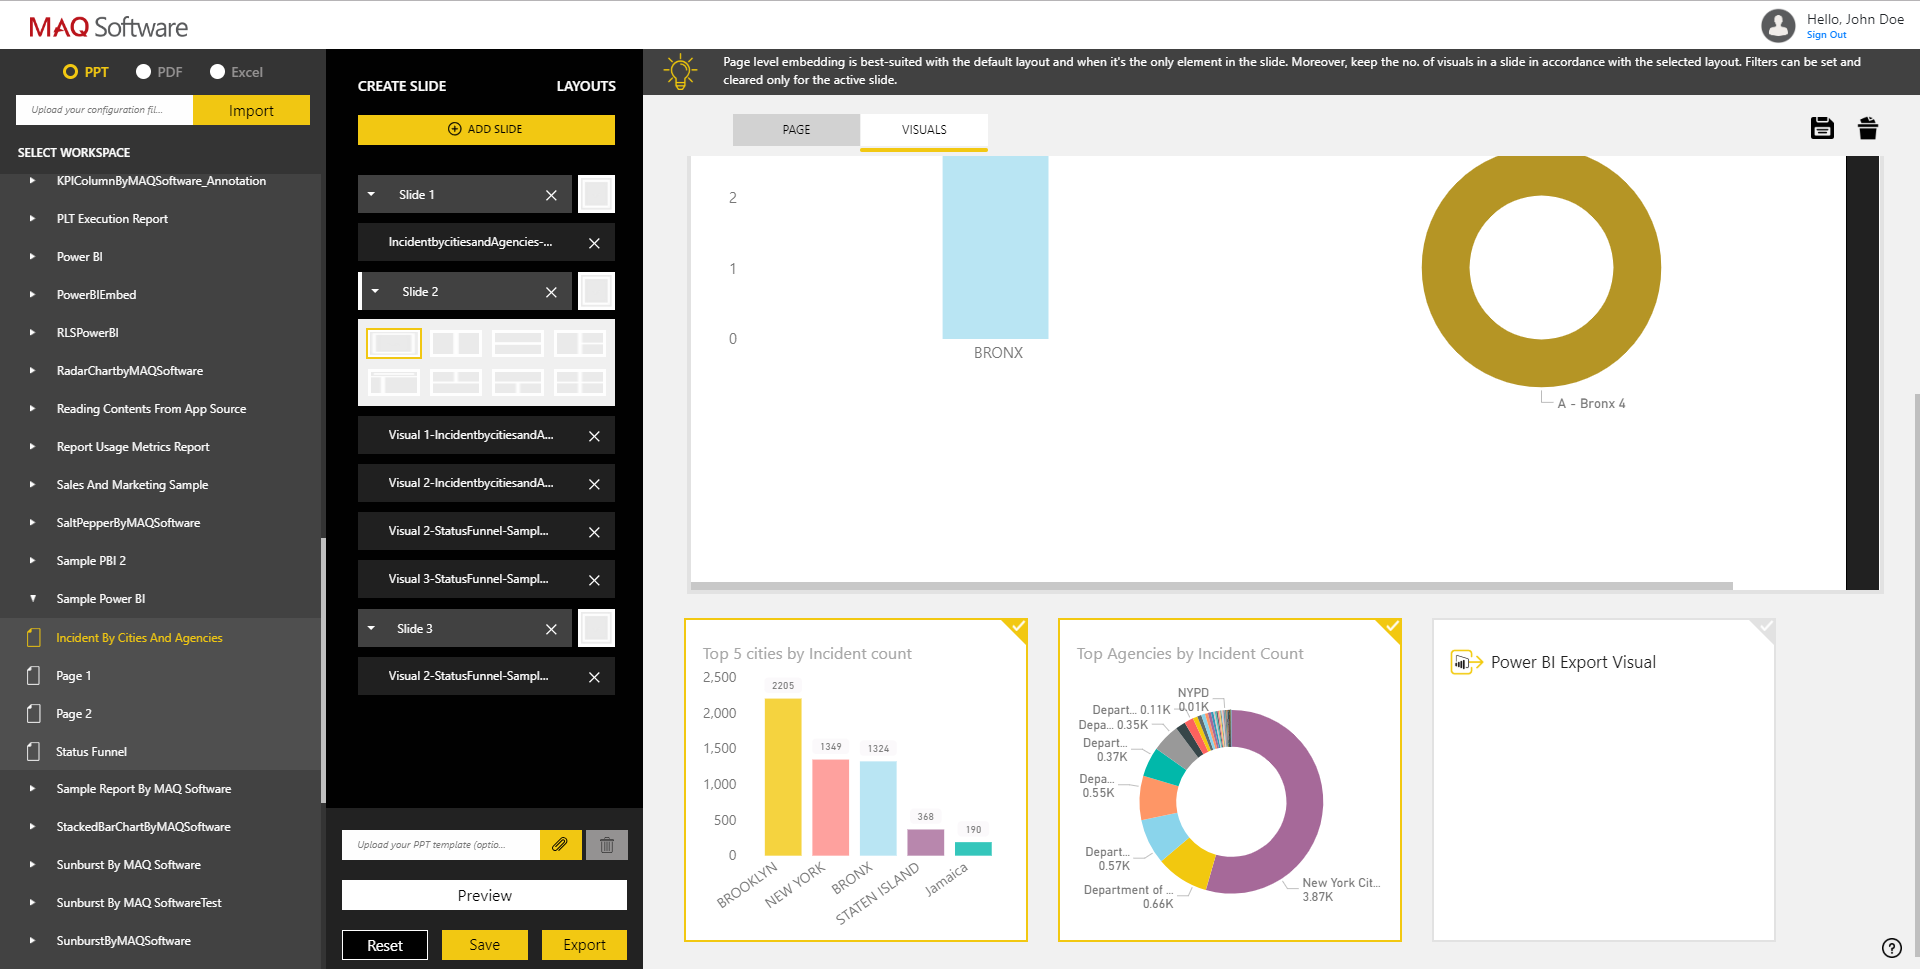 Figure 6: Choose a custom PPT template or use a default layout
-
You can learn more about the available layouts by clicking on the “Layouts” text (Figure 7).
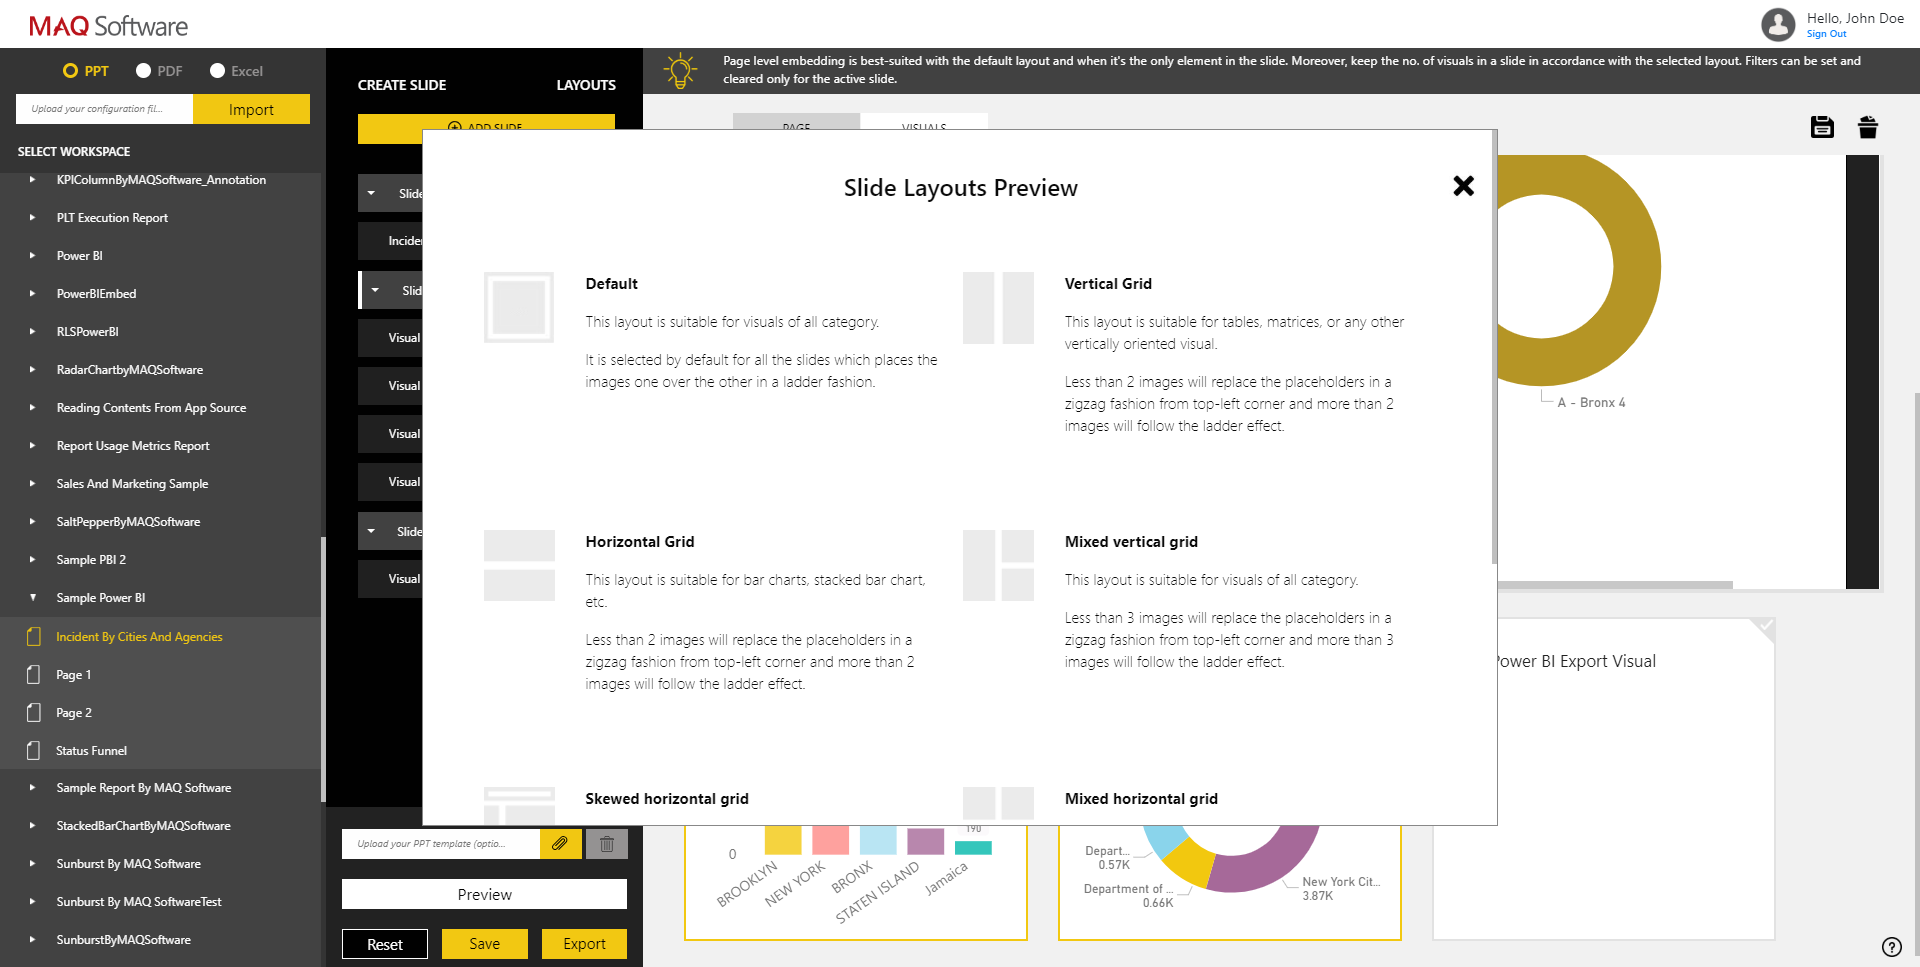 Figure 7: Description and usage of the layouts
-
To preview the file, click the preview button. You can also change the order of the visuals (Figure 8).
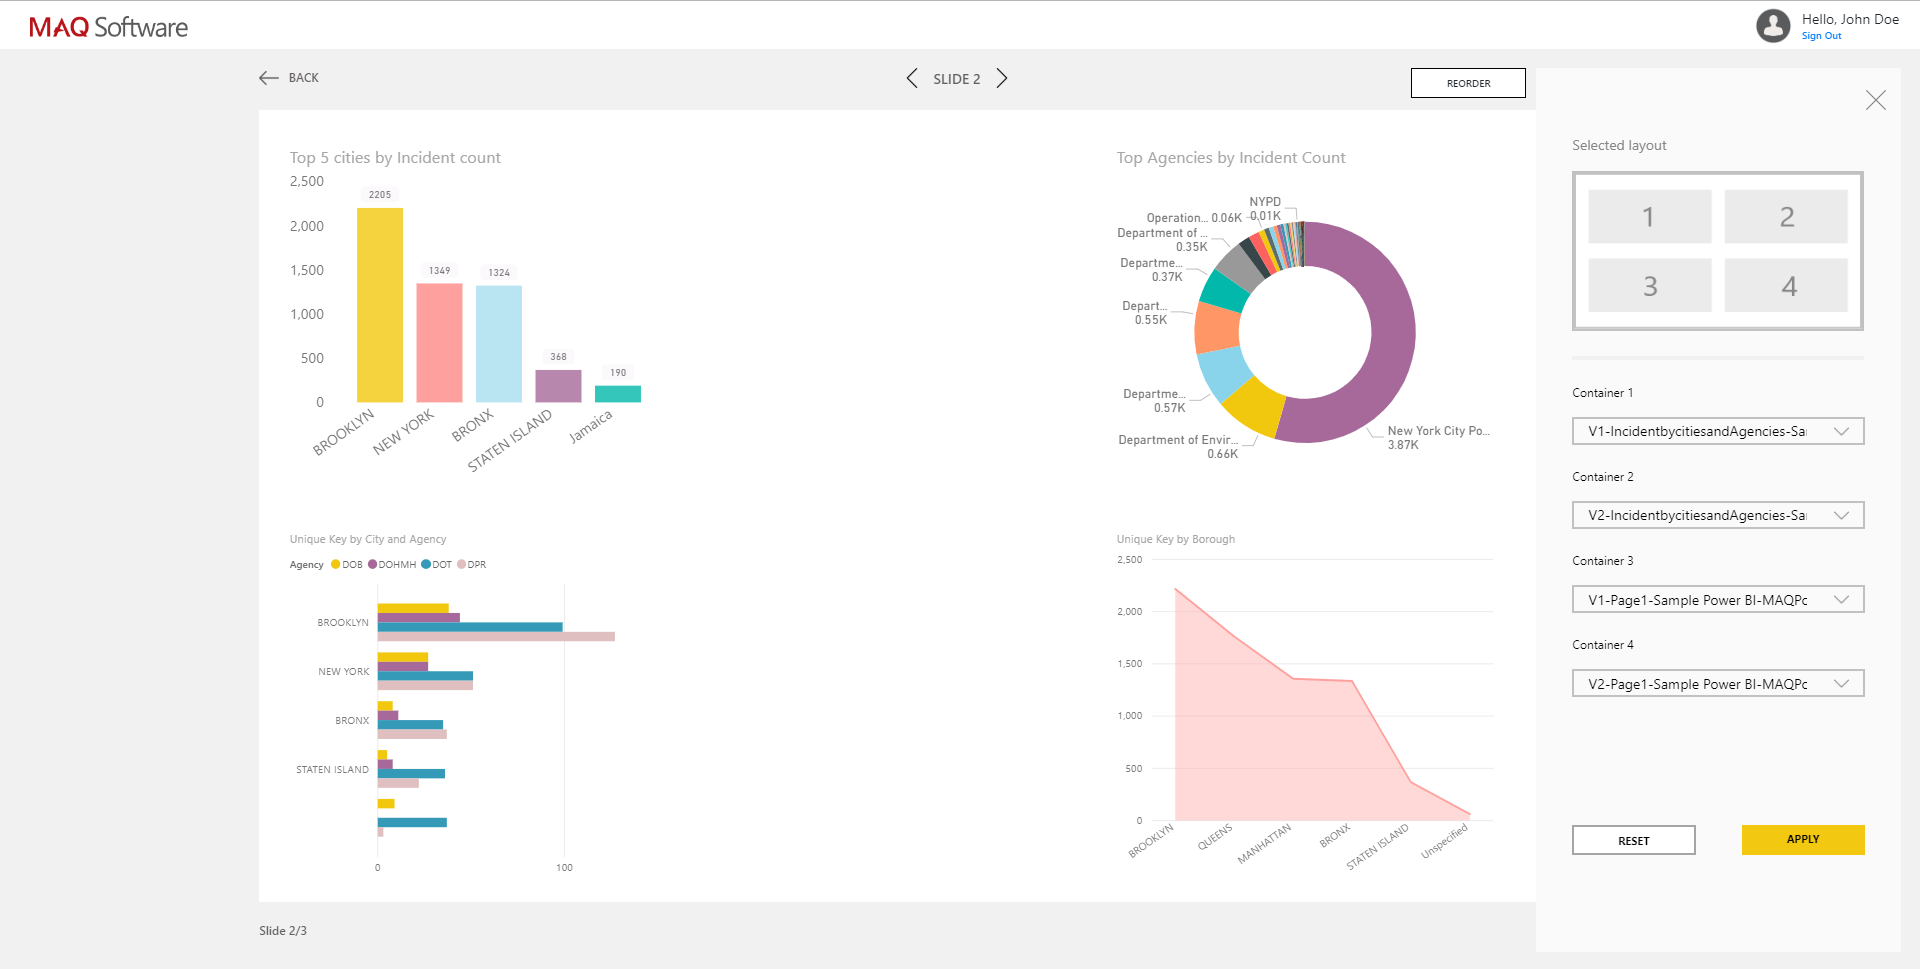 Figure 8: File preview
-
To initiate the image capture process, click the Export button. You will see a progress bar stating the status of the request (Figure 9). The export process might take a few minutes.
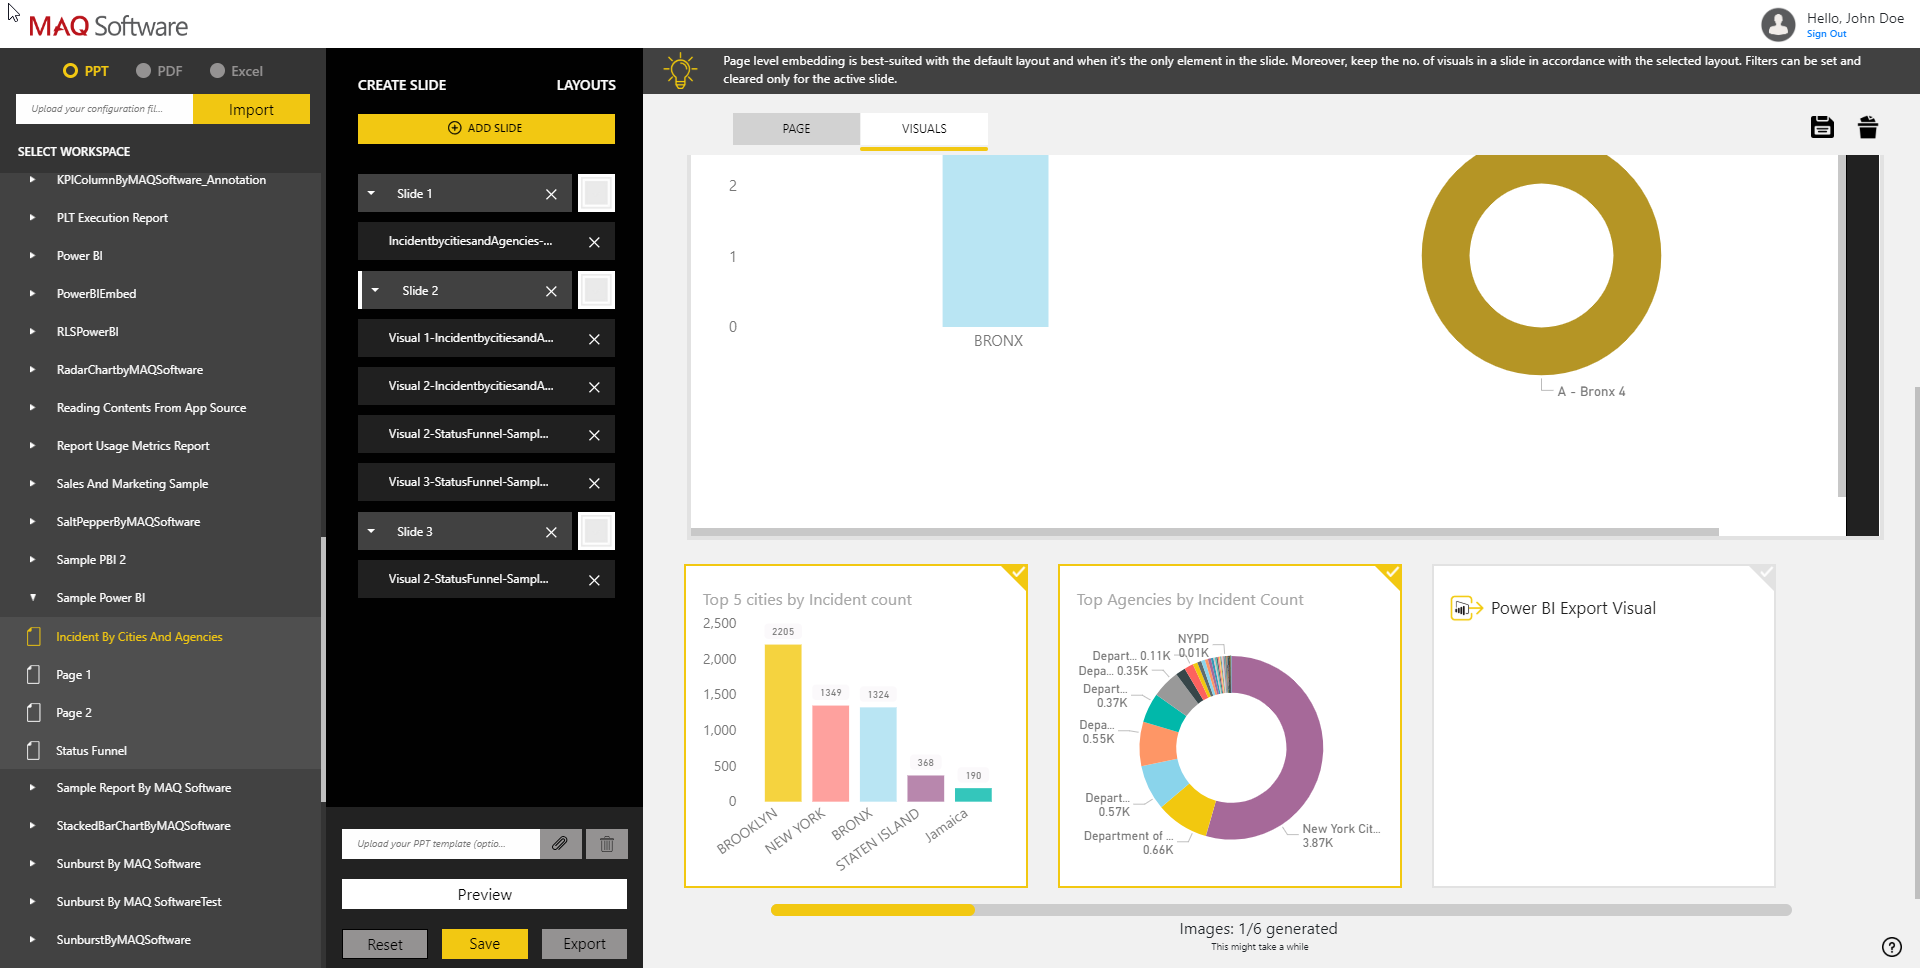 Figure 9: Export to PowerPoint progress
- Once your file is generated, it will be available for download. The download options are shown according to your browser download settings.
- Once the PowerPoint file is downloaded, you can modify or enhance it just like you would any other PowerPoint file. If you chose the PDF or Excel mode, the generated PDF/Excel file can also be treated the same as any other PDF/Excel file.
- To save your slide configuration for future use, click the save button. The download includes a JSON file which you can import back to the tool to regenerate the request (Figure 1). Note: Importing the JSON file does not work when the export mode is Excel.
Using Your Exported PowerPoint File
-
After opening the exported PowerPoint file, you will find the visuals laid out according to the selections you made in Power BI Export Tool (Figure 10).
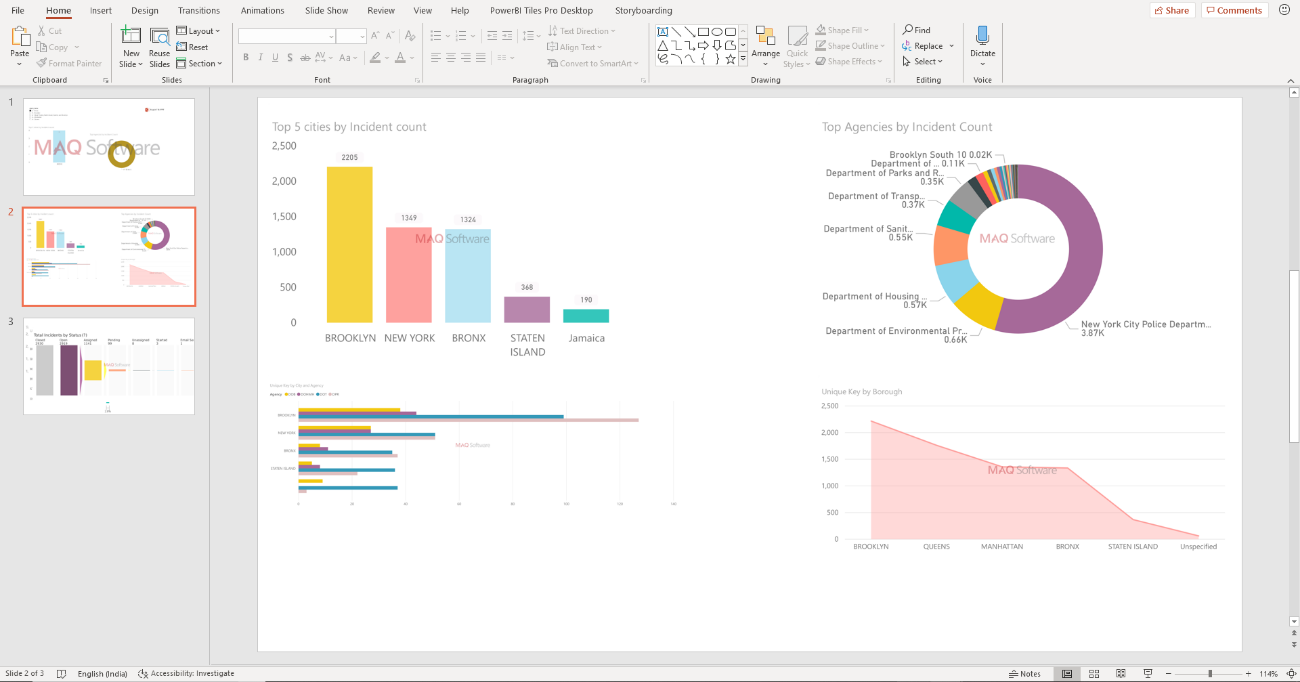 Figure 10: Visuals in the exported PowerPoint file
- Extra visuals are placed over one another in a ladder fashion.
- If you chose a custom PowerPoint template, the exported PowerPoint will include your custom header and footer along with images placed in the pre-determined image placeholders.
- If your custom template contained fewer slides than you selected in Power BI Export Tool, the tool will add more slides. Power BI Export Tool will use your custom header and footer from the slide master layout.
Using Your Exported PDF File
- After opening the exported PDF file, you will find the visuals laid out according to the selections you made in Power BI Export Tool (Figure 11).
-
Extra visuals are added to subsequent pages.
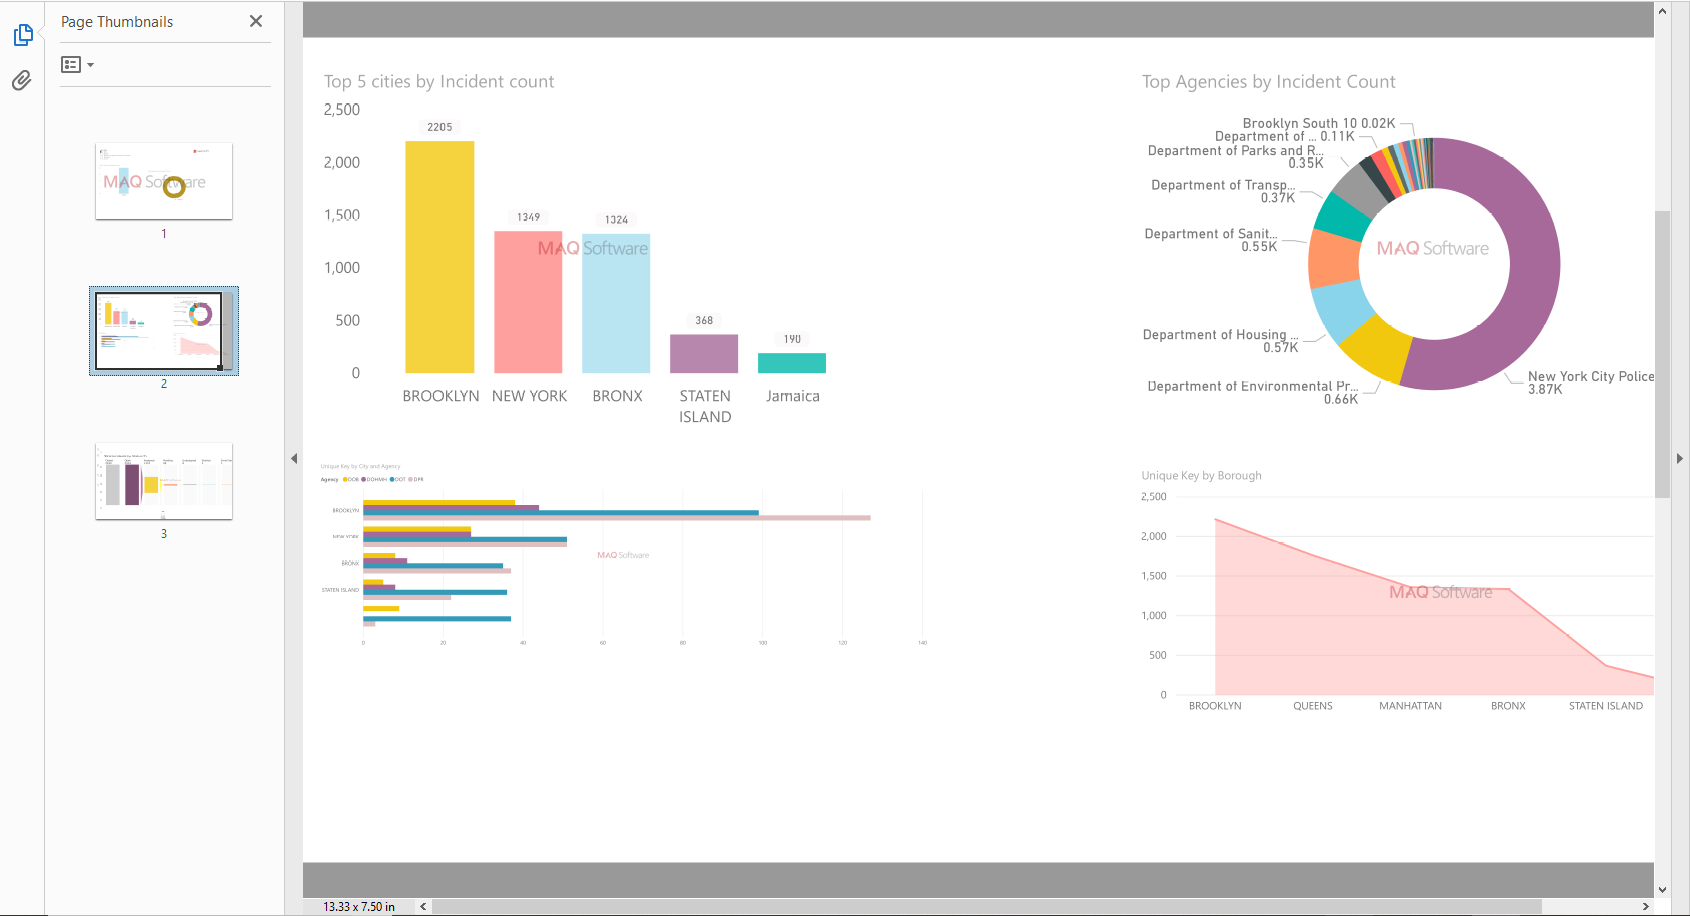 Figure 11: Visuals in the exported PDF file
Using Your Exported Excel File
- After opening the exported Excel file, you will find the visuals according to the selections you made in Power BI Export Tool.
-
In Excel mode, the layout is overridden, and all selections are placed in subsequent worksheets (Figure 12).
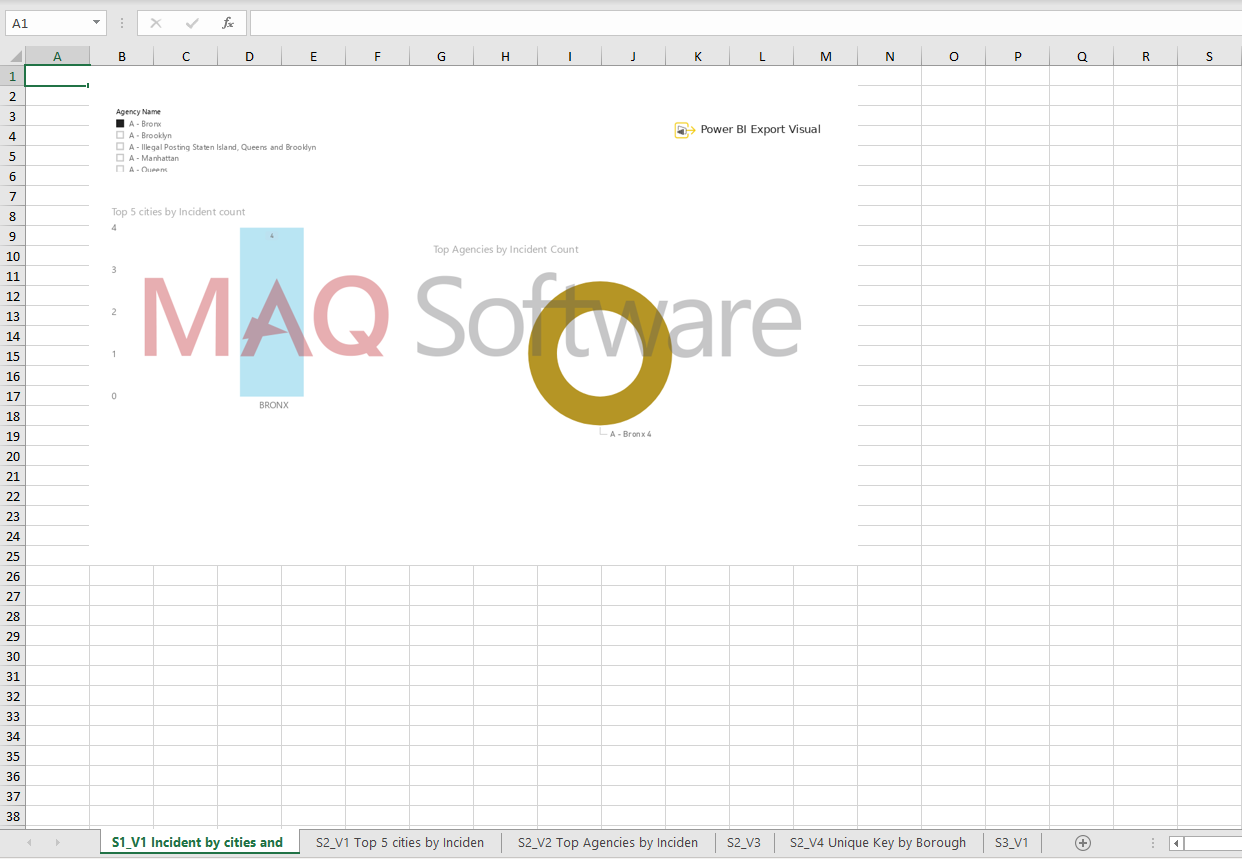 Figure 12: Exported Excel file
-
Each worksheet contains a screenshot according to the selection made in Power BI Export Tool. Data content is limited to the visuals; page data is not exported. (Figure 13).
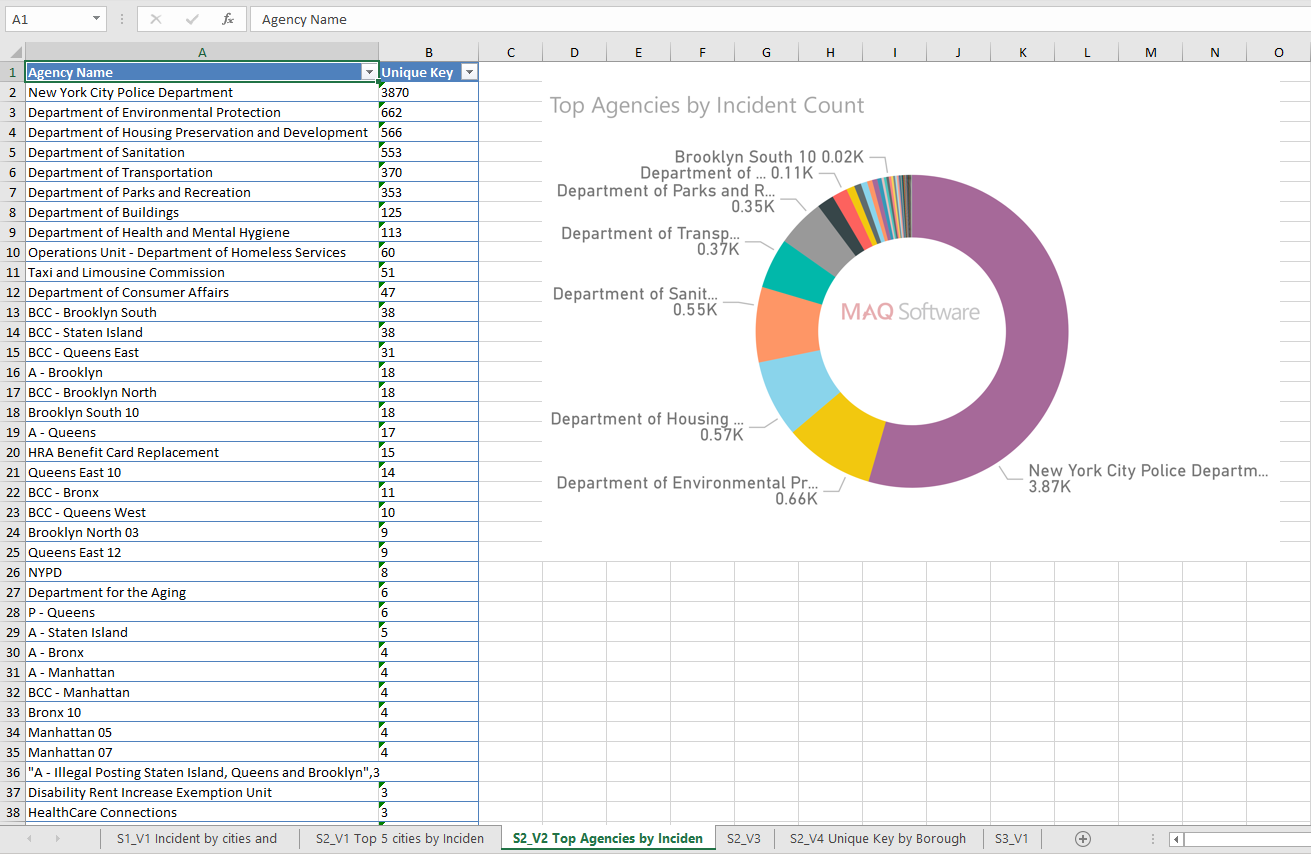 Figure 13: Exported visual with its data
- ArcGIS visual is not supported.
- To reduce selectable visuals displayed on the canvas, Power BI Export Tool does not include slicers, text visuals, or image visuals.
- Exporting report images to PPT, PDF, or Excel may take a few minutes to complete. Factors that can impact the time include the structure of the report, the number of images exported, the number of slides created, and the load on the Power BI Export Tool.
- Exported documents show the original visuals as they were saved in the report.
- Power BI Export Tool creates PowerPoint slides and PDF pages in the standard 16:9 ratio, regardless of the original page sizes or dimensions in the Power BI report.
- Page data is not exported in Excel mode.
Limitations
Acquiring the Tool
To discuss customization and prices, please contact our sales team at Sales@MAQSoftware.com