Whiz by MAQ Software
Improve the user experience of your reports
Whiz by MAQ Software is a Power BI External Tool that helps team members easily identify common mistakes in the Power BI Model, and assists developers in formatting the DAX measures used in the report and to document the model—all with a single click.
It also enables team members to identify UI/formatting discrepancies in your report across visuals, whilst easing the documentation of the fields used in the various visuals of the report.
With the high adoption of Power BI and organizations moving towards self-serve reporting, there is an increase in the number of large enterprise models in Power BI involving multiple tables and measures. With that scale, it becomes difficult for developers or reviewers to perform sanity checks for the whole model, and it can eventually lead to sub-optimal deliverables. Whiz by MAQ Software helps with conducting the basic checks with a single click, measuring the possible gaps in the overall model against some of the recommended practices
Business Scenario
Fortune 500 companies today generate and analyze extensive amounts of data from their business operations. Most of them use Power BI as a tool to derive these insights, enabling data-driven business decision-making. Based on our experience of working with multiple enterprise customers, we saw a consistent pattern of scaled adoption of Power BI report building leading to numerous problems. This included issues relating to governance, user experience, performance of reports, consistent use of brand guidelines and themes, using custom components, and ensuring the right architecture for the solutions.
Existing Process adopted by all our customers:
Though there are many external tools available in the community that help developers in various aspects of the development stage, they need to rely on multiple tools to ensure a complete coverage of tasks. They then still must perform manual analysis/sanity checks on these sizable models to identify possible deviations from best practices. In short, there is currently not a single tool that helps in analyzing the Power BI data model as well as report visualization.
Key Business Challenges:
- Reduce Manual Effort – Reduce the effort required to analyze whole data models and reports
- Quick Insights – Identify possible deviations from the recommended practices related to the model and report design
- Spell Check – Highlight spelling issues in the text to users
- Single Click Documentation – Document all Power BI Model and report pages using a single click
We have designed a single tool to help developers and reviewers perform model and report analysis, assisting them in delivering a consistent output that follows their organization’s standards.
Its capabilities include:
-
Model Analysis
- Summary – Analyze the model against some of best practices and present the results in a single view
- Spell Check – Identify possible spelling mistakes in table, column, and measure names
- Measure Formatting – Identify the different types of measure formatting applied to the measures
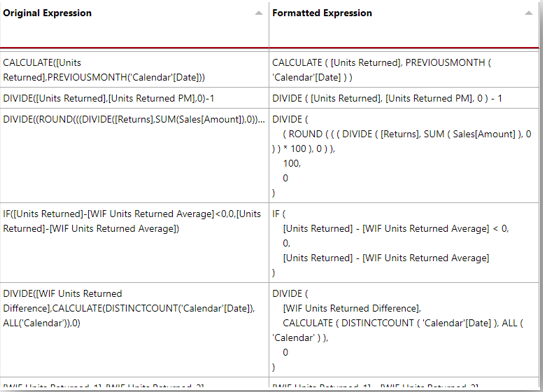
- DAX Formatting – Format all the DAX measures using a single click (uses DAX Formatter nuget package developed by SQLBI
- Documentation – Complete documentation of the Power BI Model including all the tables, columns, measures, and relationships
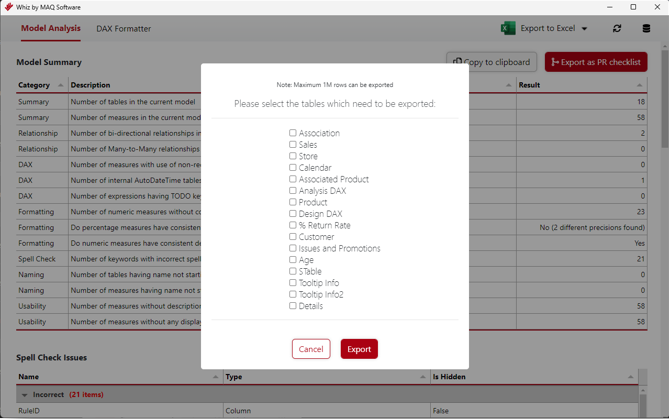
- Export – Export actual data from the tables present in Power BI Model for offline analysis
-
Report UI Analysis
- Summary – Analyze all the pages of the report; display report and page level insights to help users easily understand the different types of visuals on each report pag
- Spell Check – Identify possible spelling mistakes in common components directly visible to end users (Visual Title, Axis Title, Button Text, and Textbox content)
- Format Properties Summary – Compare basic format properties for all the visuals of the report in a single view (Title font properties, Axis font properties, etc.)
- Visual Summary – Document columns and measures used for each visual of the report
Installation Steps
-
Run Whiz Setup 2.0.0.exe on your local machine (Contact
CustomerSuccess@MAQSoftware.com for access to the
set up file).
-
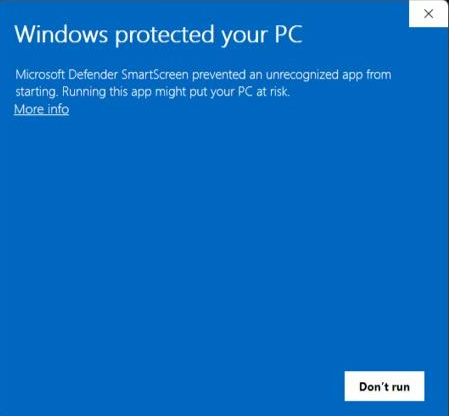
If prompted about the Windows protection, click on More info, then click on
Run Anyway.
-
On the User Control Prompt, click on Yes to start the installation.
-
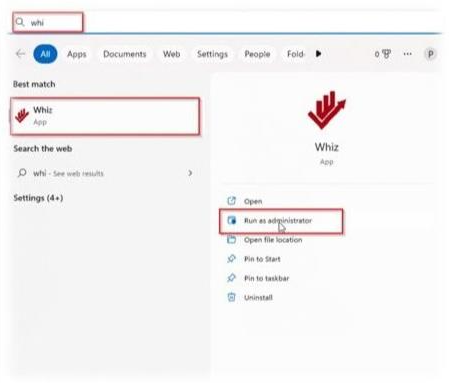
Search for the ‘Whiz’ Tool and click on Run as Administrator (Run as
Administrator is required for performing Report UI Analysis)
-
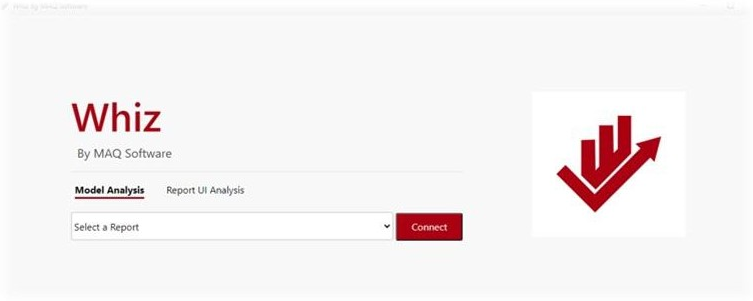
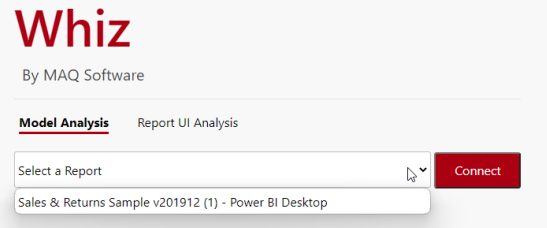
The home page will be shown as below.
How to Use Whiz & its Features
Model Analysis
-
Launch the tool directly from the External Tools tab of Power BI Desktop or connect
an open report for Model Analysis.
-
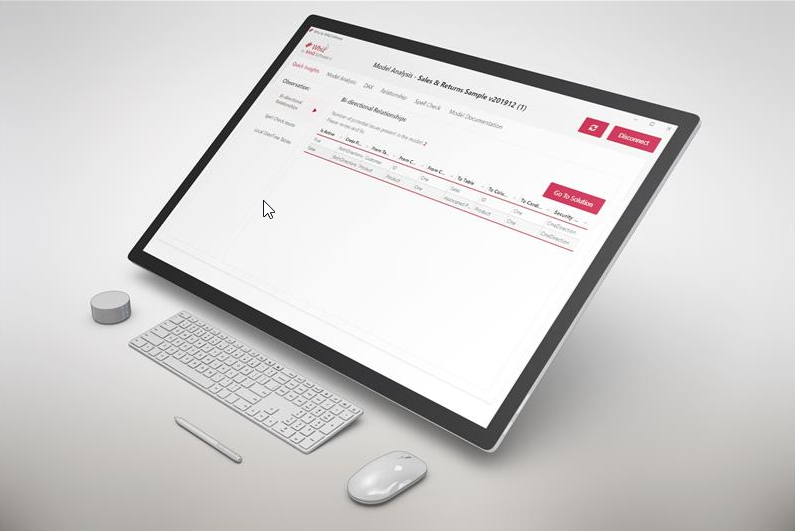
Navigate to the Model Analysis tab to access the features (view model summary,
potential spelling issues, etc.).
Features:
-
Overview
- Model Summary can provide useful insights about your report model. It helps
identify model issues which may impact performance, such as bi-directional
or many-to-many relationships, use of non-recommended DAX, inconsistent
formatting of measures in the model, and spelling issues.
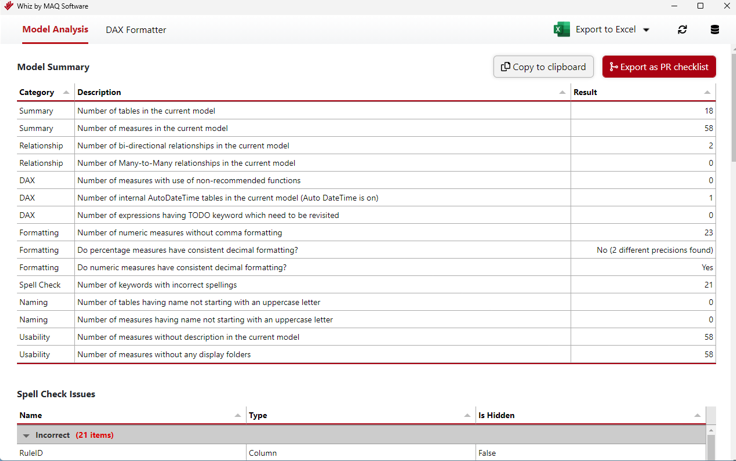
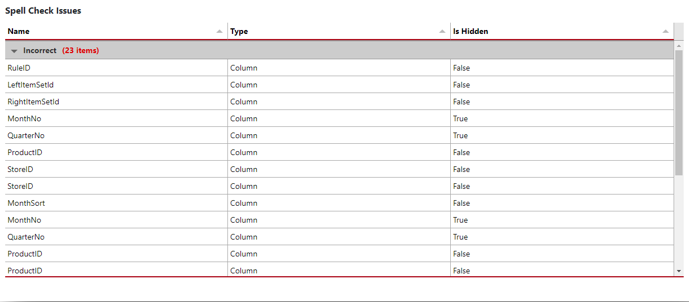
- Spell Check can highlight potential spelling errors.
- How to ignore/whitelist specific words from Spell Check: In the
installation directory (C:\Program Files\Whiz), update
SpellCheckIgnore.txt with the words to be whitelisted (separated by a
new line).
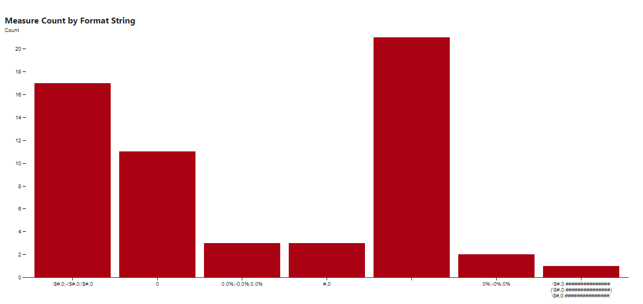
- Bar charts can help with visualizing and highlighting the number of
different format strings and usage of non-recommended functions.
- Ability to export model metadata to Excel is available.

- Ability to export actual table data is available.
- Model Summary can provide useful insights about your report model. It helps
identify model issues which may impact performance, such as bi-directional
or many-to-many relationships, use of non-recommended DAX, inconsistent
formatting of measures in the model, and spelling issues.
-
DAX Formatter
- Preview measures with the correct formatting.
- Configuration options that are available for DAX Formatting:
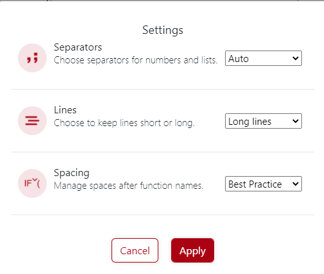
- Ability to select specific measures or format all measures in one go.
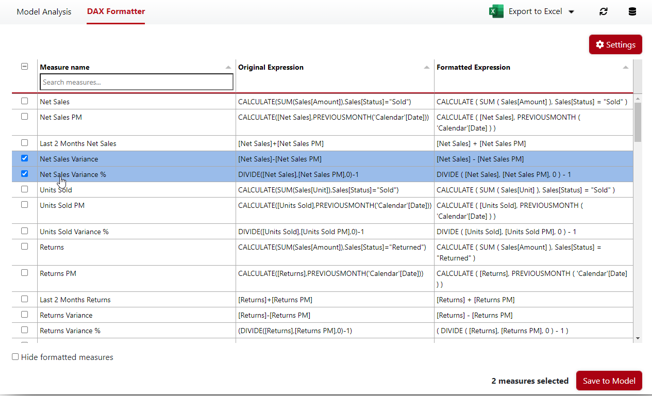
- Preview measures with the correct formatting.
Report UI Analysis
- Upload .pbix for Report UI Analysis.
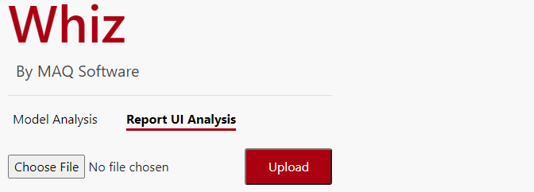
- You are now ready to access the features.
- Features:
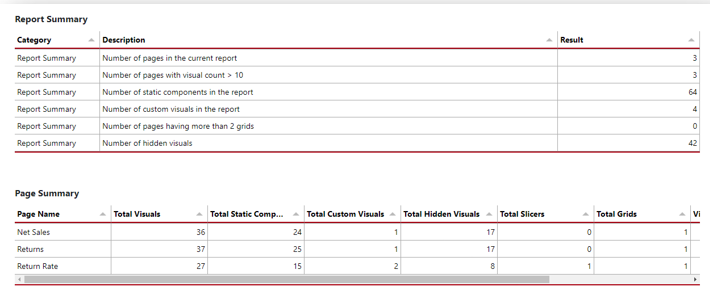
- Report and Page summary
-
Provides a summary of the pages, visuals, and other visual components
present in the report.
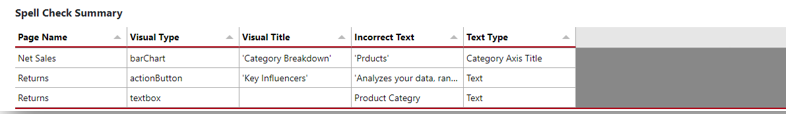
-
Spell Check: Highlights possible errors in visual titles, axis titles,
button text, etc.
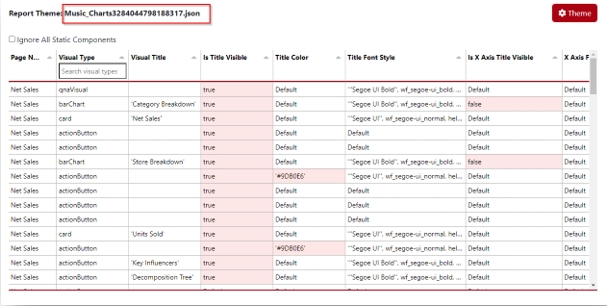
- Format properties
-
Displays the formatting properties of all visual components present in the
report.
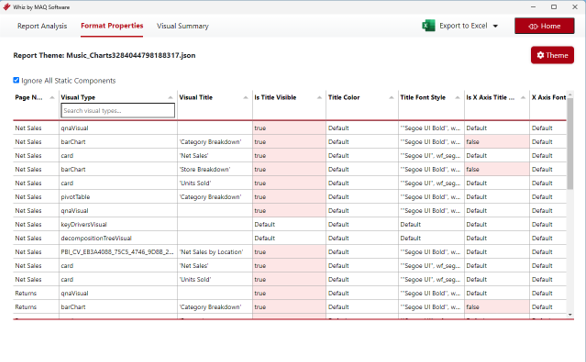
-
When a custom theme is applied to the report, all the deviations from the
theme are highlighted in the grid.
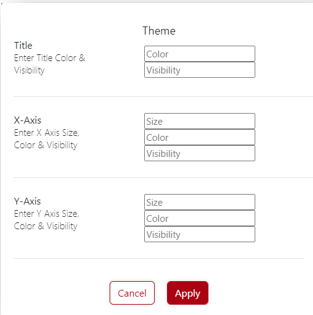
-
When no custom theme is applied to the report, you can define your own
properties under the theme section. Any deviations from the provided values
will be highlighted in the grid.
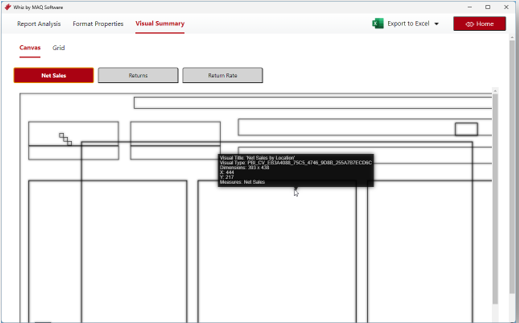
- Visual Summary
- Visual Summary displays information about all the visuals present on the selected page.
-
Canvas displays a layout preview of all report pages.
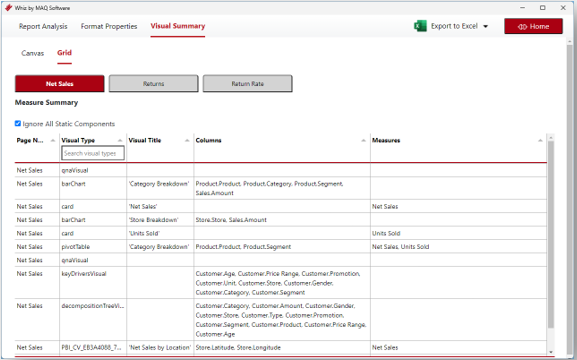
-
Grid displays information about individual visuals like their titles,
columns and measures used.
-
Export Layout Summary: Ability to export Report, Page, Spell Check & Visual
Summary information to an Excel sheet along with a new sheet containing a
list of all the fields which are being used in a specific Power BI report.
Callouts
- Format Properties page will extract format properties for the default Power BI visuals only (out of the box visuals).
- Model Analysis is not supported for Live connected reports. The actual dataset file for model analysis needs to be used.