Text Analytics Engine - User Guide
Overview
Text Analytics Engine analyzes and visualizes text from various customer channels including social media comments, surveys, support systems, event feedback, and more. Text Analytics Engine is designed for teams and leaders within customer support, sales and marketing, UI/UX, and event planning. You can use the insights generated from our Text Analytics Engine to:
- Improve products and services
- Increase social media engagement
- Organize more effective events
- Improve customer support response
Features
- Pre-trained machine learning (ML) models that generate insights from unstructured text
- Improve accuracy of analysis - Build a solution for reliable and accurate analysis of reports
- Over 30 interactive charts and visualizations, including net sentiment, positive, negative and neutral comments, emotion distribution, driving sentiment factors, word clouds, key phrases, and common topics
- Downloadable PDF reports
Getting Started
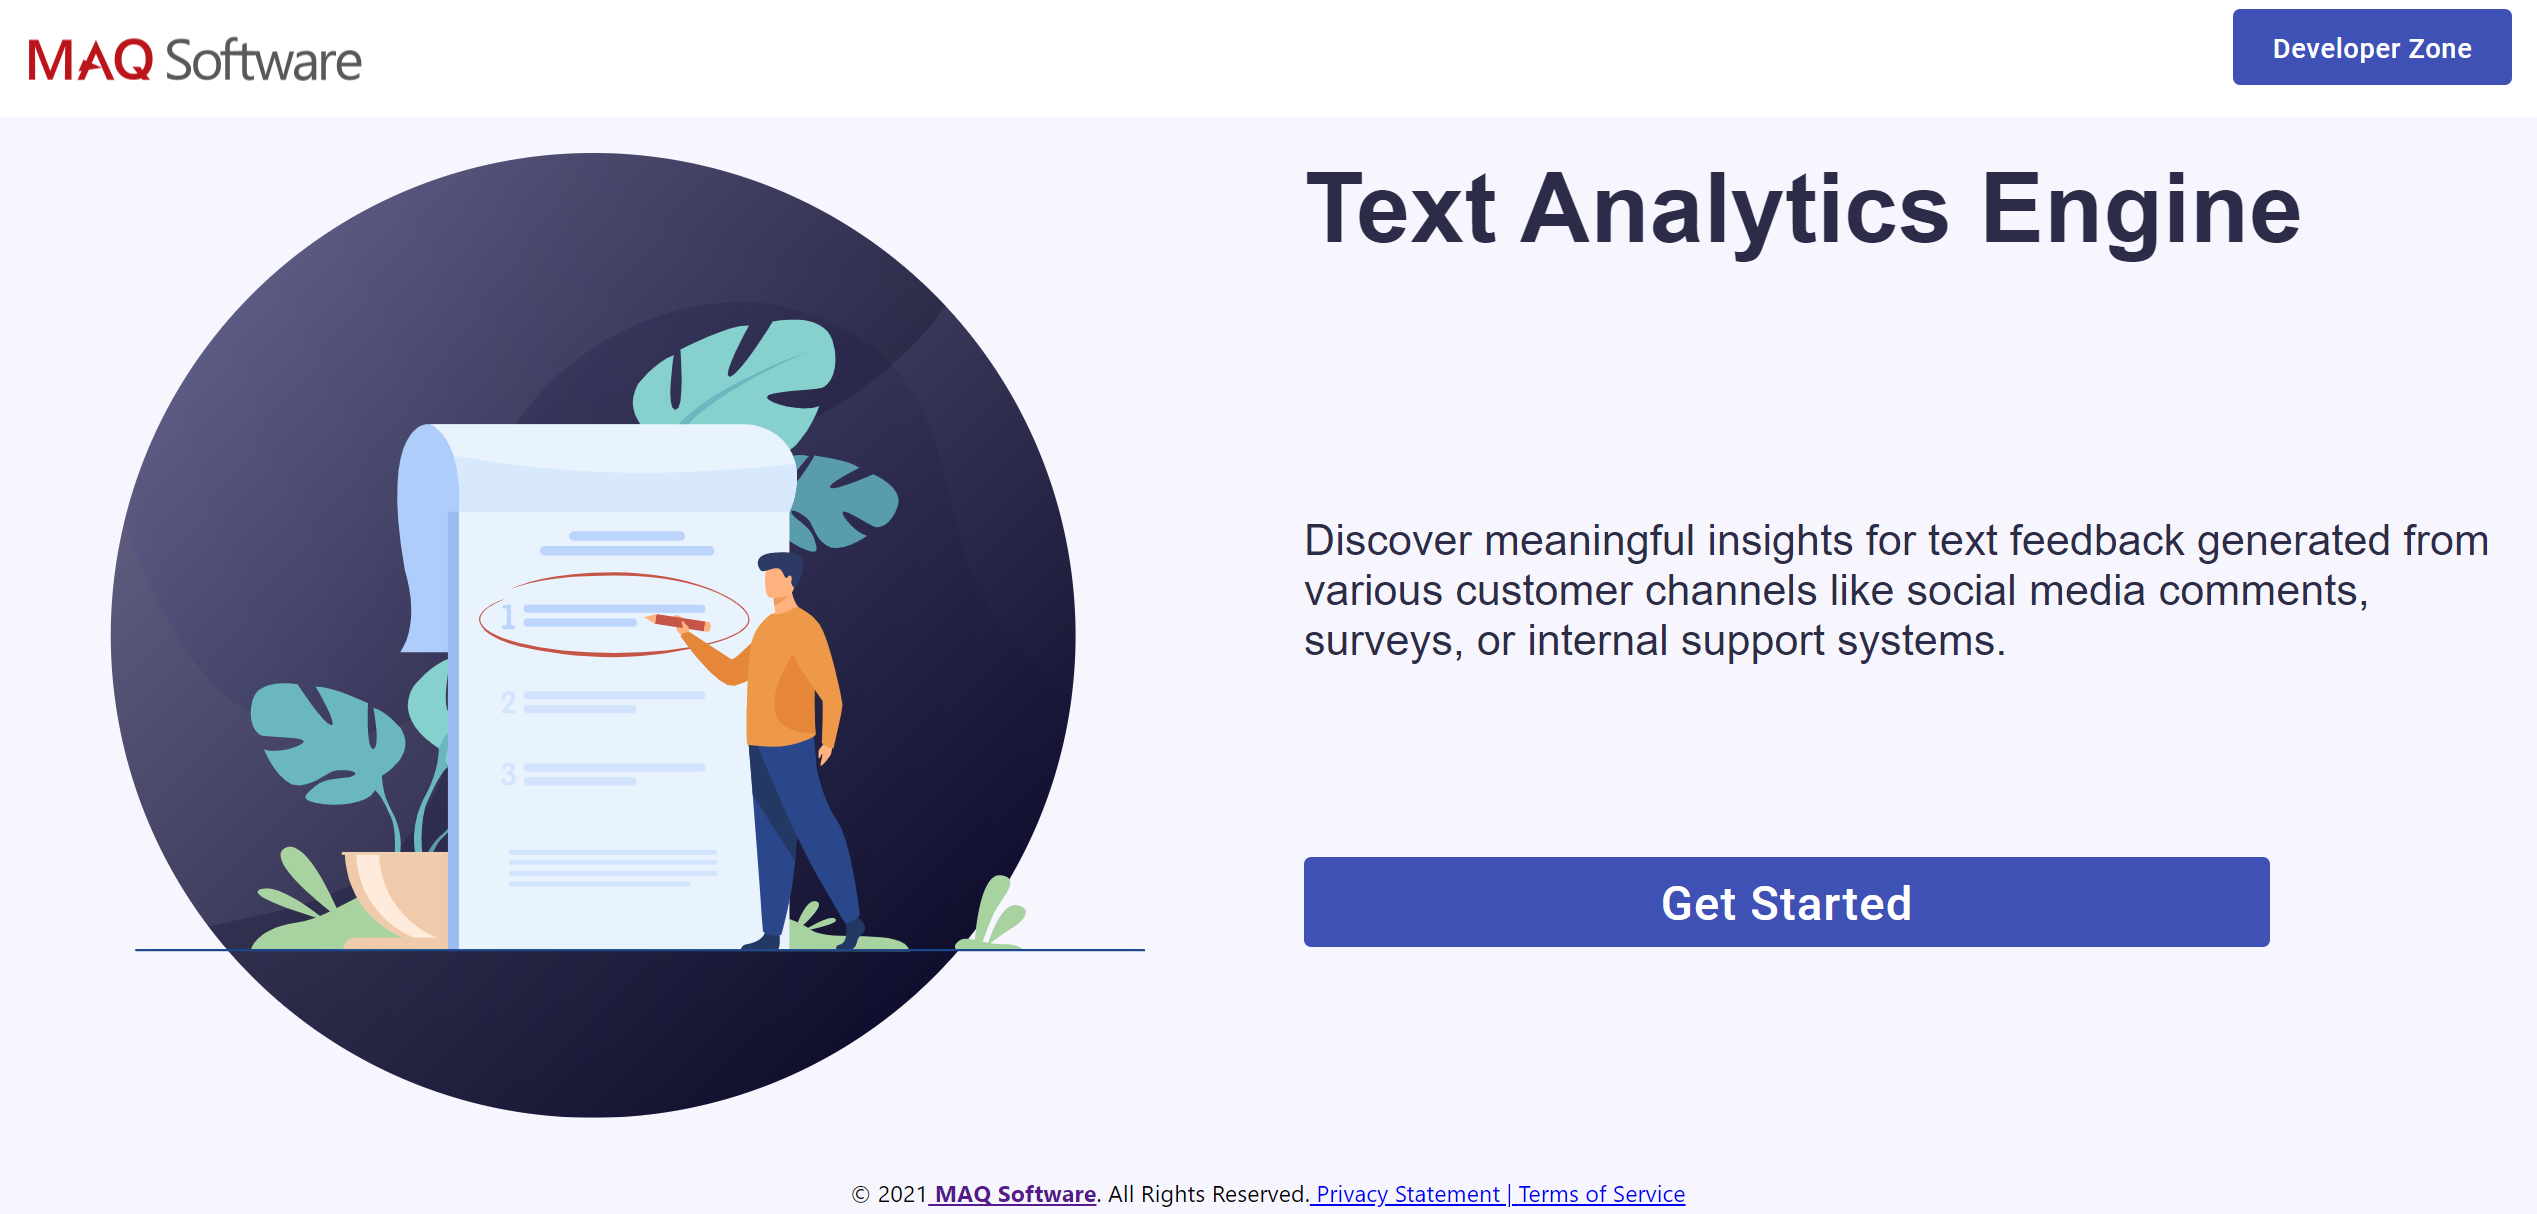
Figure 1: Get Started Page
-
Open the Text Analytics Engine.
-
If prompted, sign in to your Microsoft account.
-
Click “Get Started” – you will be directed to the Data Connect page.
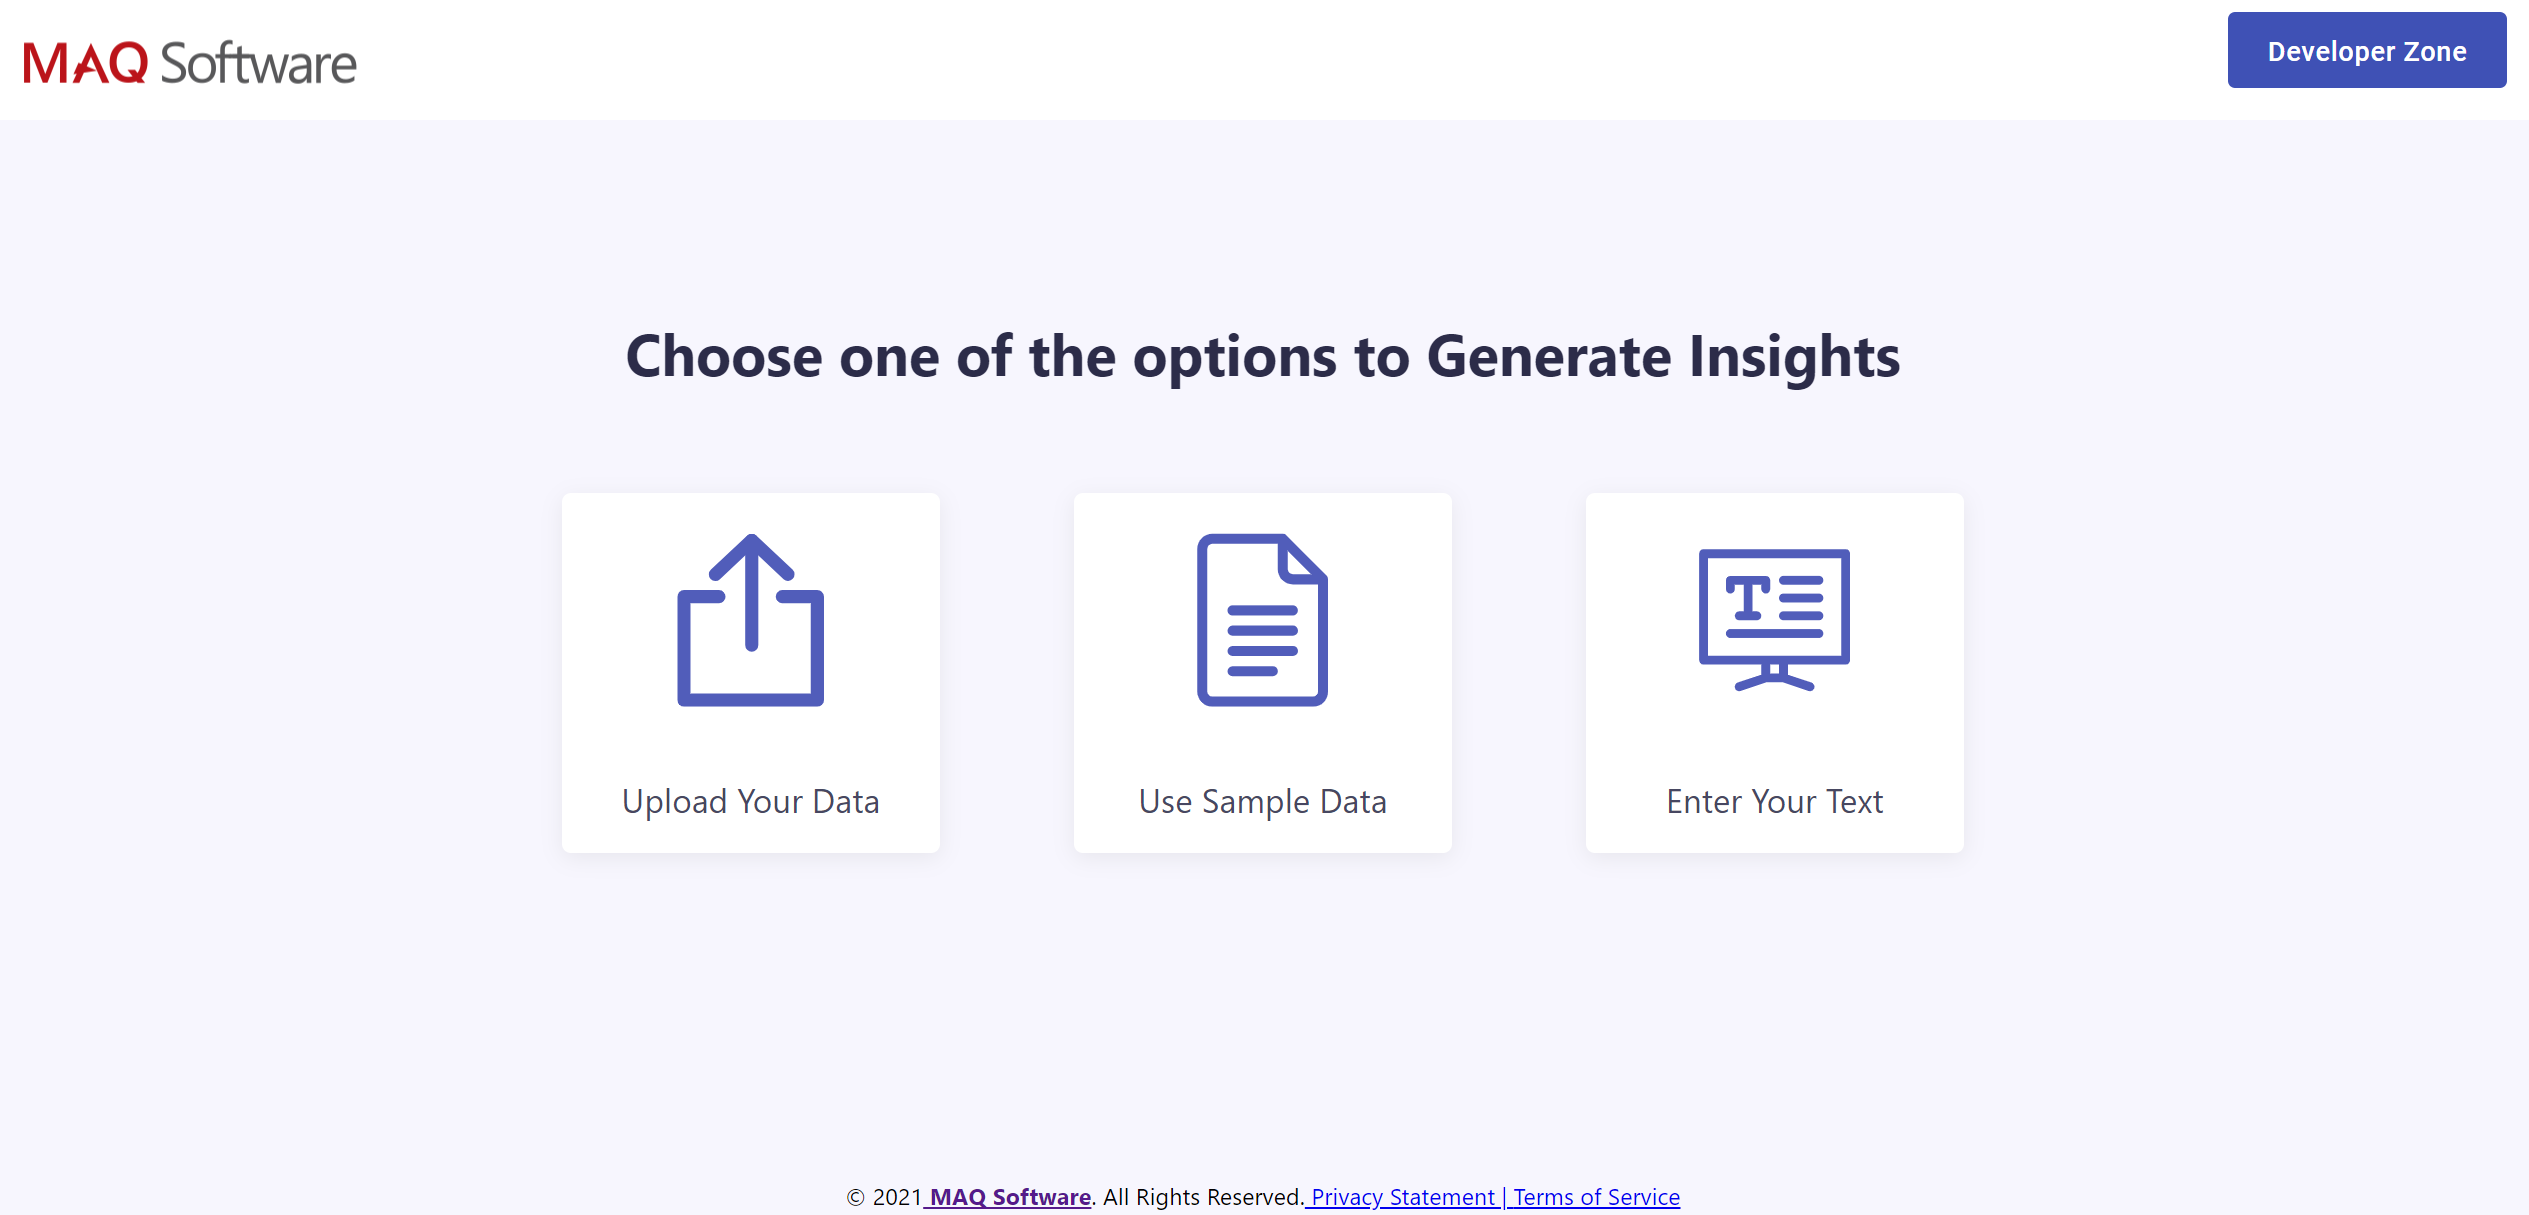 Figure 2: Data Connect page
-
On the Data Connect page, choose any of the following text input options:
- Upload Your Data: upload and analyze your own text (the engine supports xlsx and csv)
- Use Sample Data: for a quick look at how the tool works, use one of our sample datasets
- Enter Your Text: type or copy your text directly into the text box (use the “Enter” key as a delimiter)
- Once you have chosen your text input, you will be redirected to the Data Selection page. If you chose a sample dataset, the data selection fields will be pre-selected. If you input your own data, select the data category from the dropdown. Note: If your data is event-related, the visualizations will be different than the visualizations for “Other Data”.
- Select the column you want to analyze (if using a spreadsheet with multiple columns).
- Enter the number of topics you want to analyze.
- When you’re ready, click “Generate Insights” – you will then be directed to the Data Overview page. Depending on how large your dataset is, this may take a few minutes.
- Once your data has loaded, you can explore key insights on the Data Overview page. From there, you can drill down into the Topic Modeling, Sentiment Analysis, and Developer Zone tabs for more specific data breakdowns. For more information on key points and visualizations, click the information icon in the top right-hand corner of each visualization.
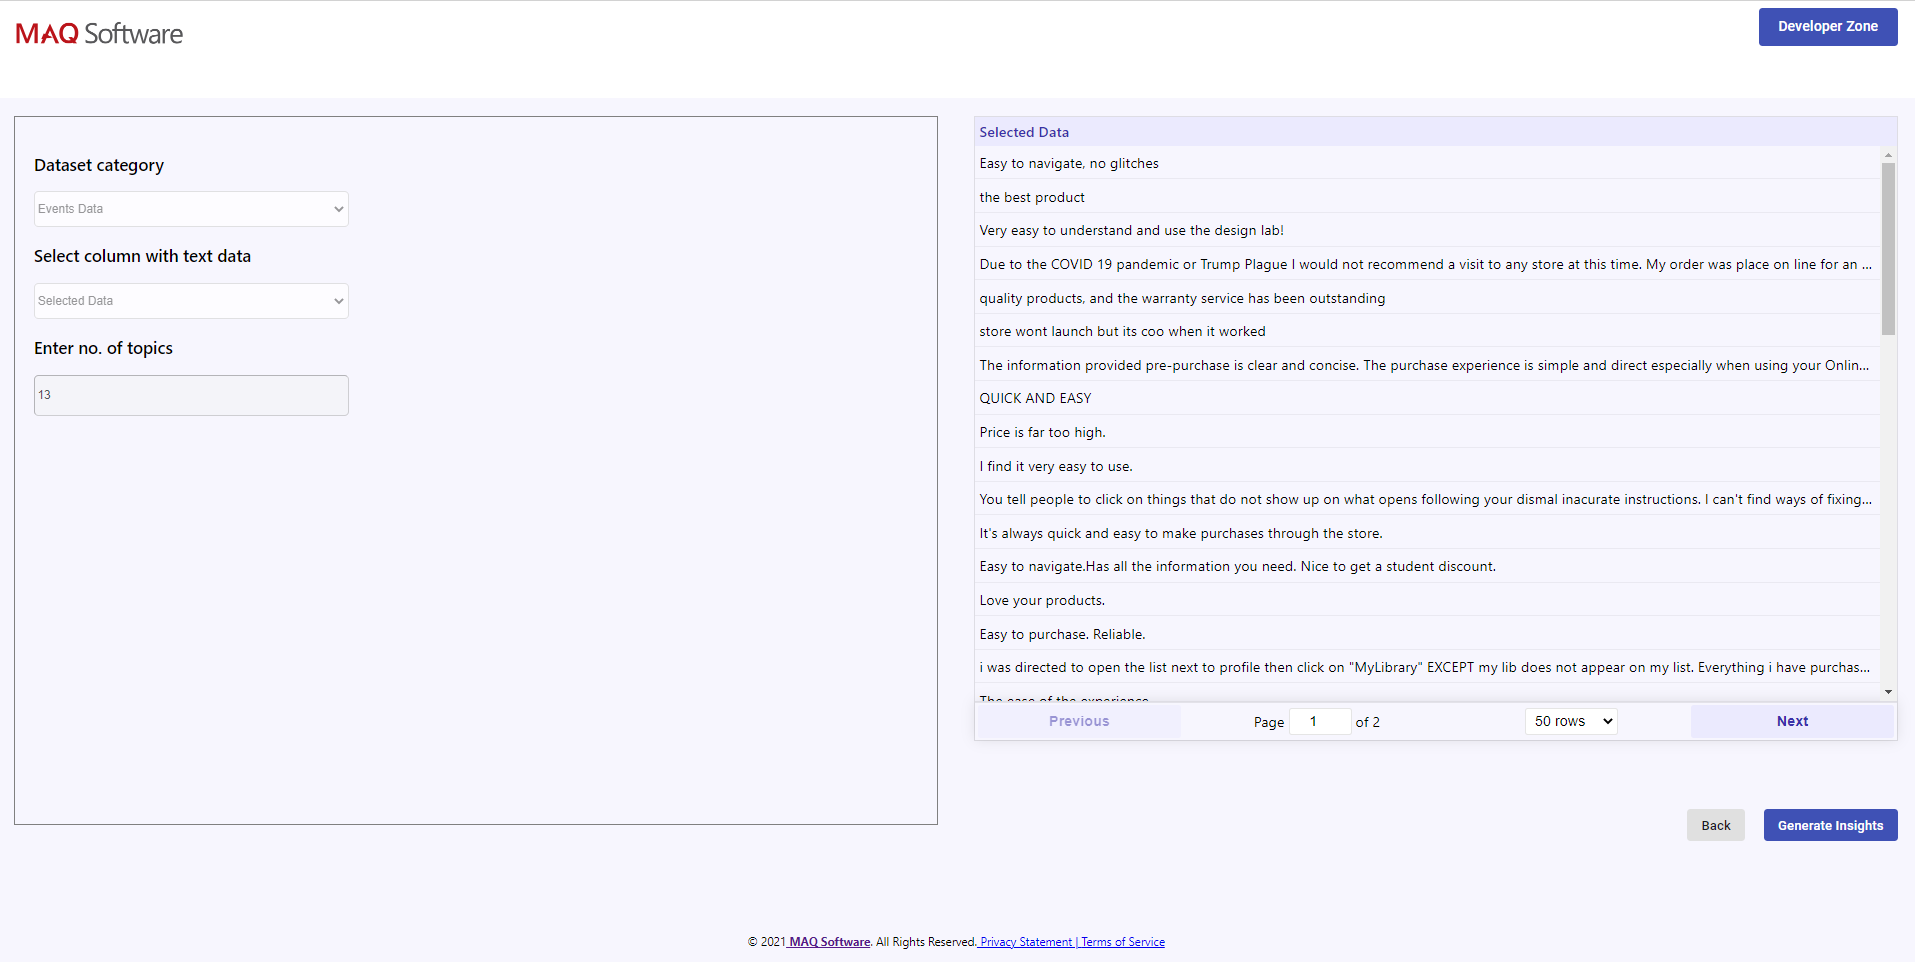
Figure 3: Data Selection page
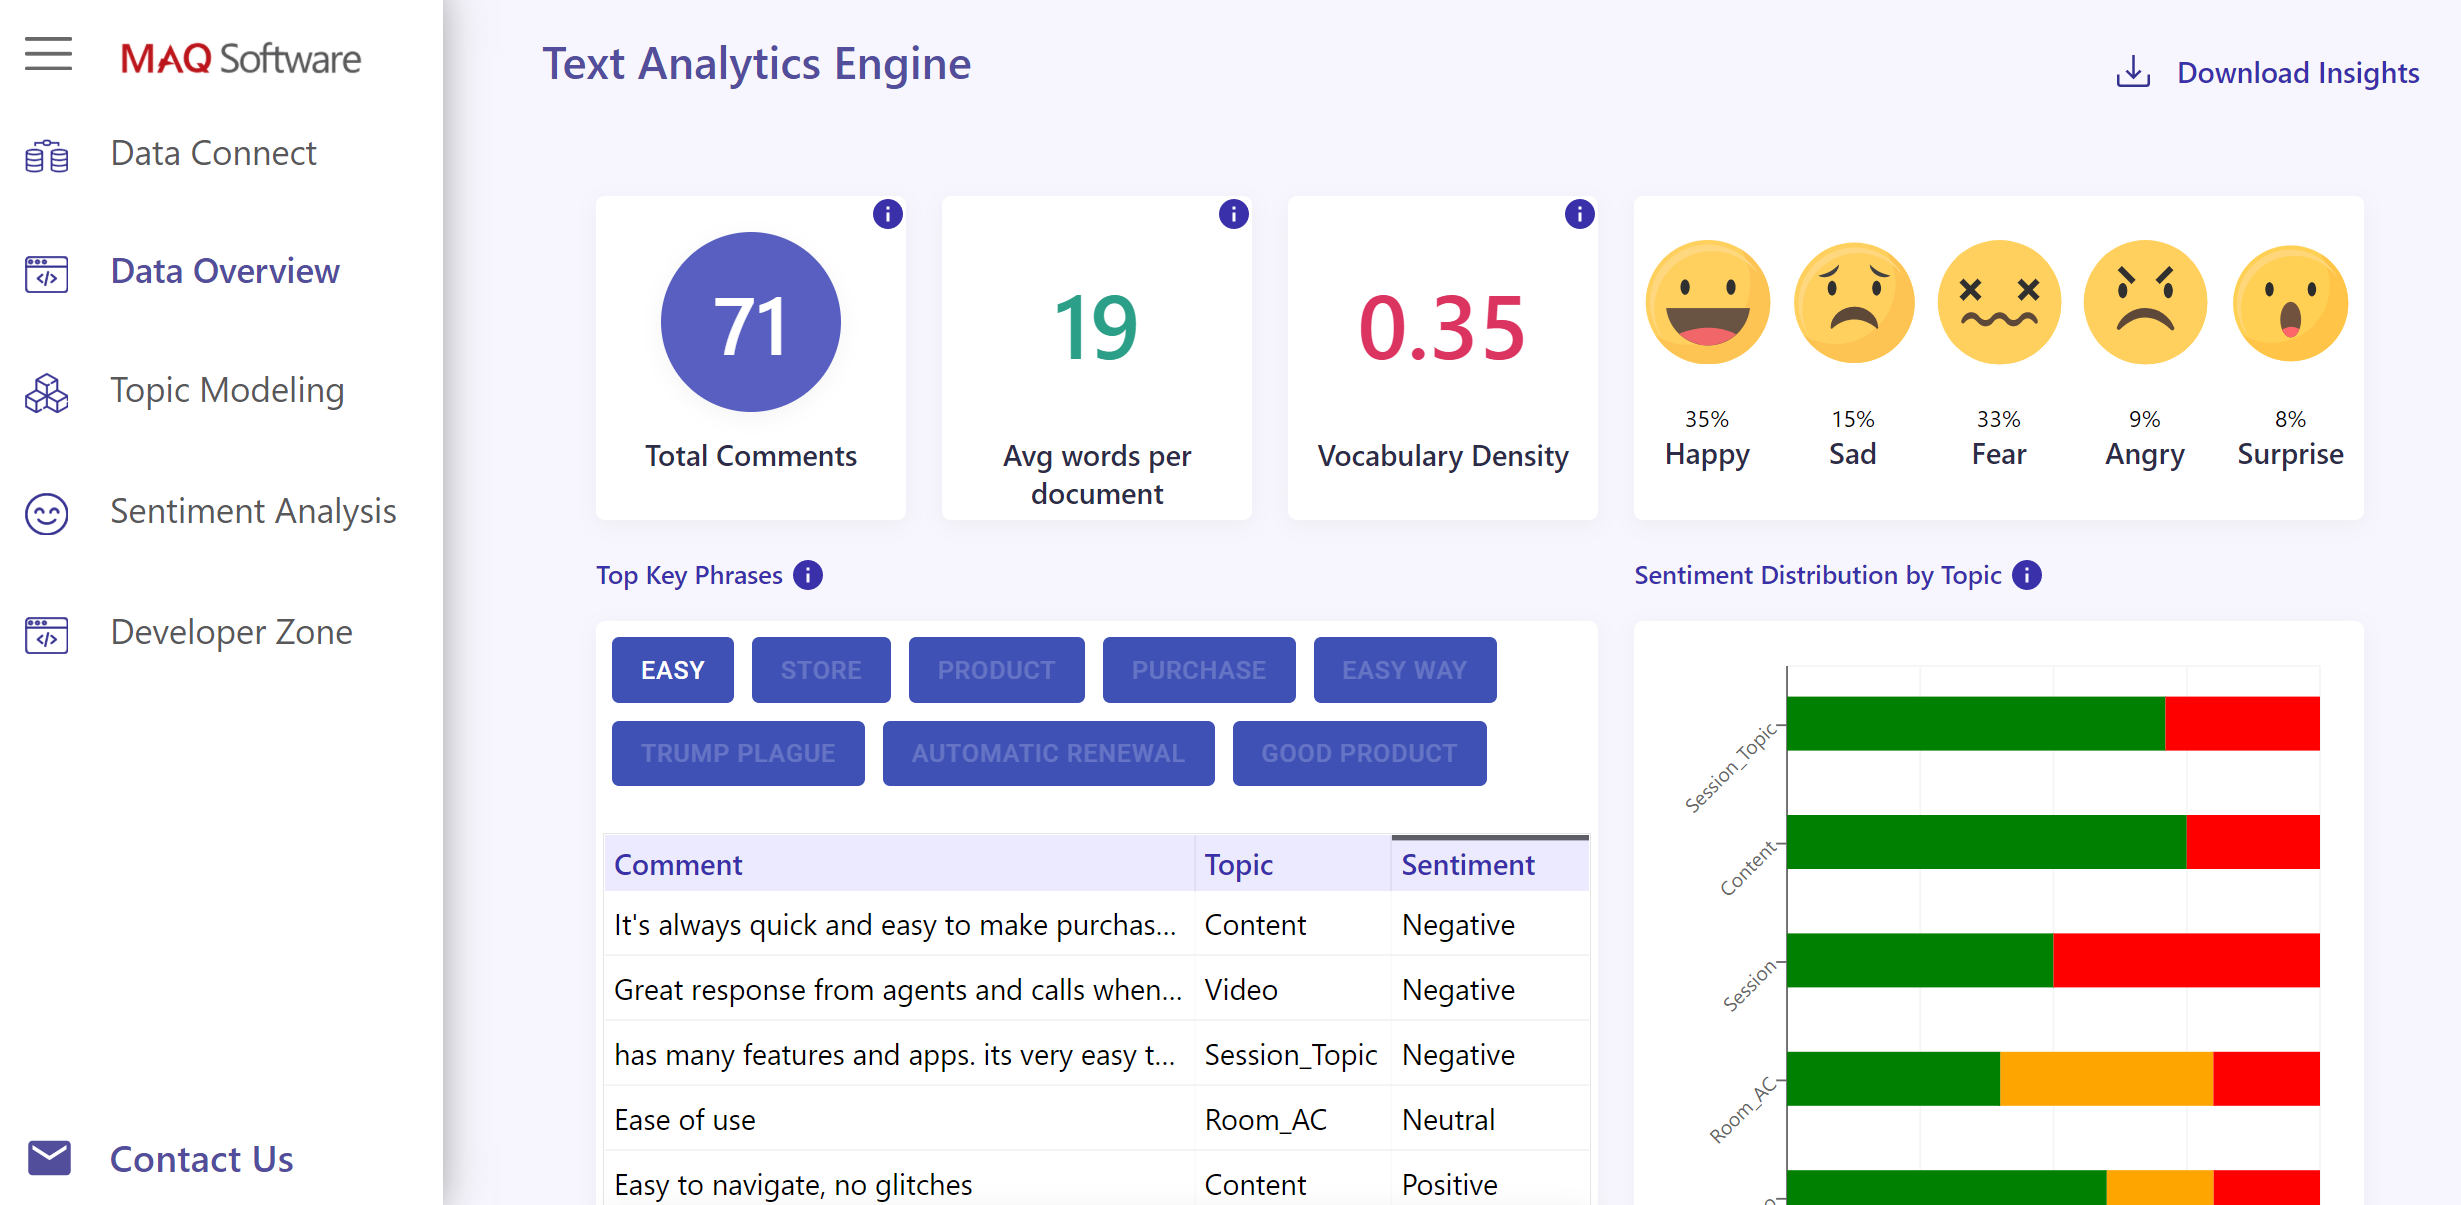
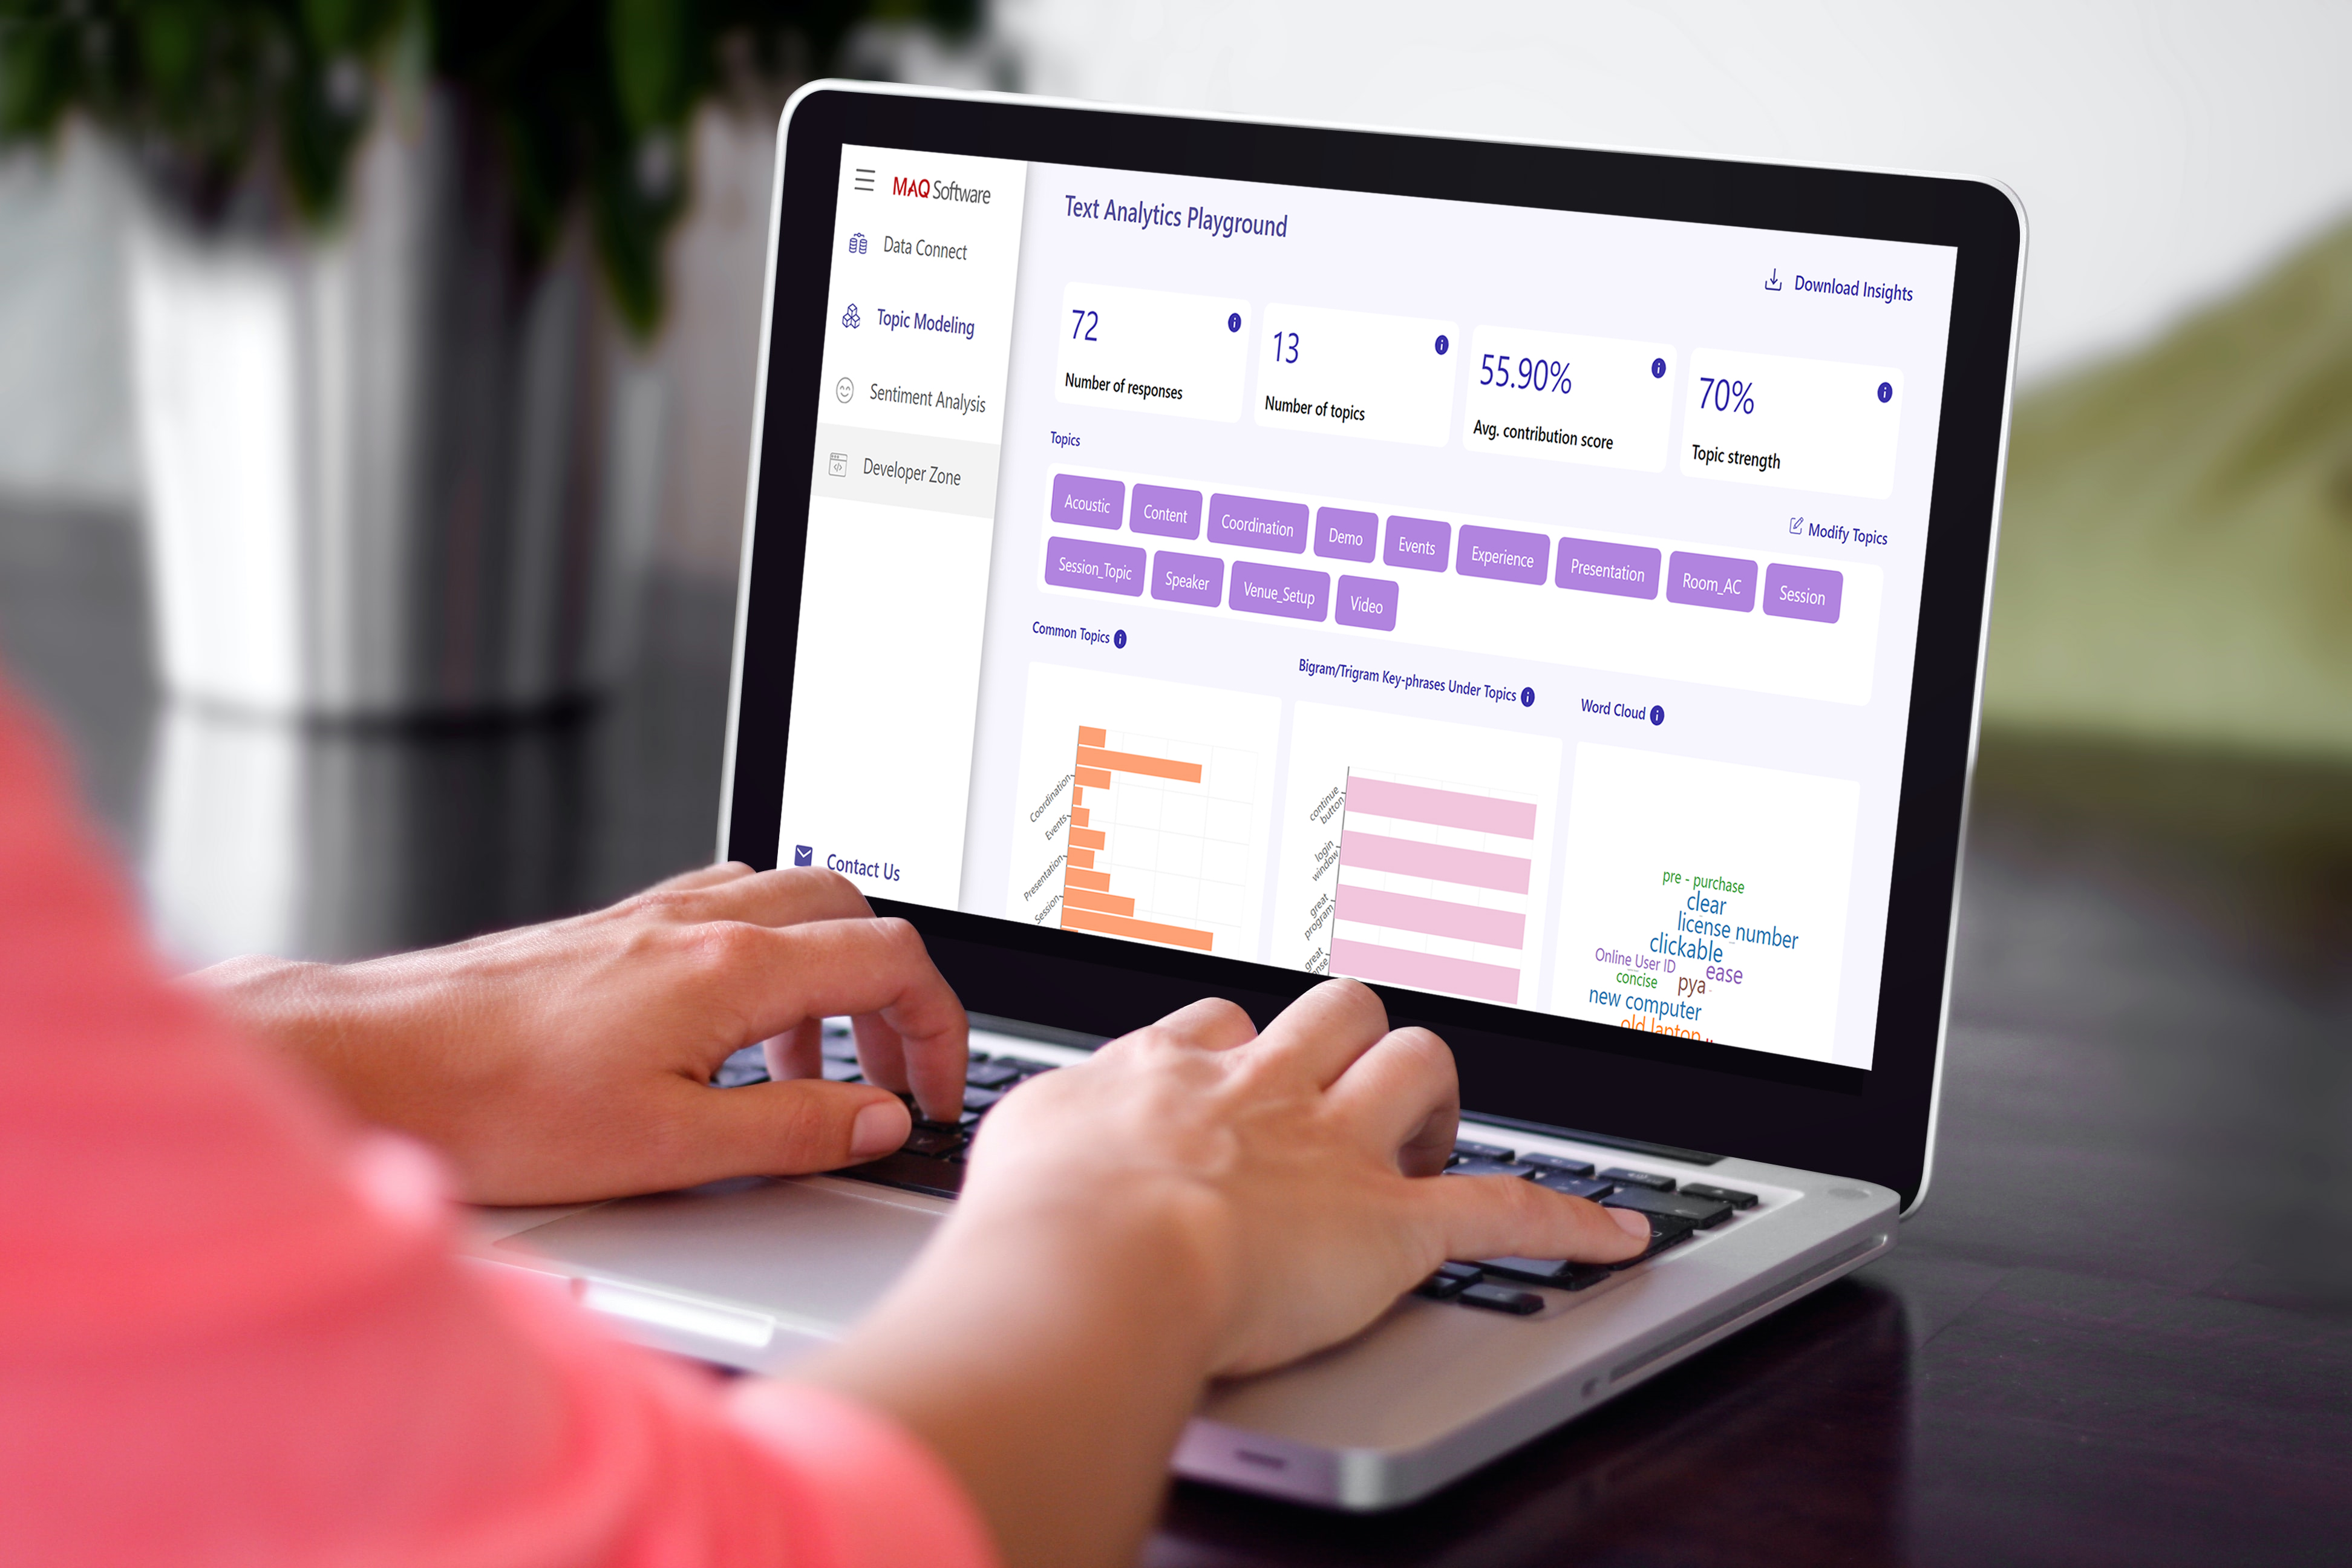
Figure 4: Data Overview Page
How to Modify Topics
A topic is the subject of the text. For example, the following comments fall under the topic “customer service”:
- “MAQ Software customer service is fantastic!”
- “An MAQ Software support rep reached out right away.”
- “I am very happy with the quality of customer service.”
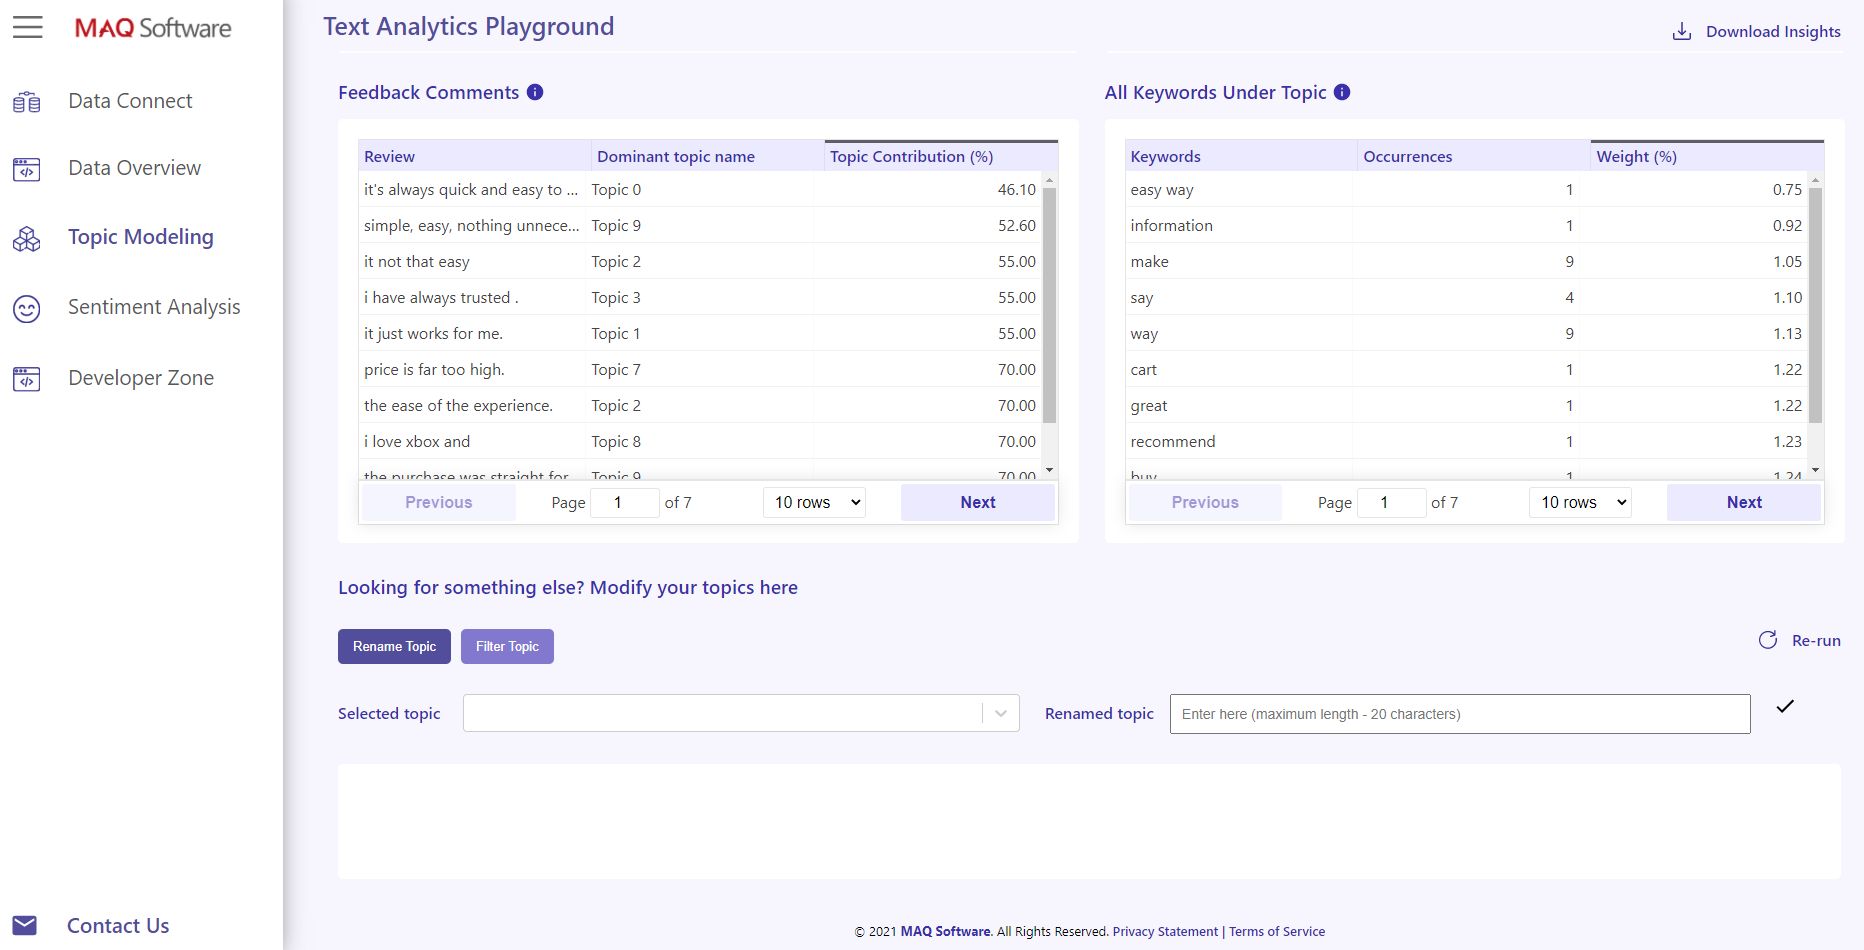
Figure 5: Rename Topics
- If using “Other Data”, you can rename topics by navigating to the Topic Modeling page. Scroll to the bottom of the page and click “Rename Topic”. Note: If you rename topics and re-run the model, you will no longer be able to rename topics. Instead, you can create a new topic using the same steps. If using “Event Data”, you will only be able to create topics.
- To filter topics, click “Filter Topic” and remove the undesired topics.
- When you’re happy with your topic modifications, re-run the model for updated insights.
- For a shareable PDF, click “Download Insights” in the top right-hand corner of the dashboard.
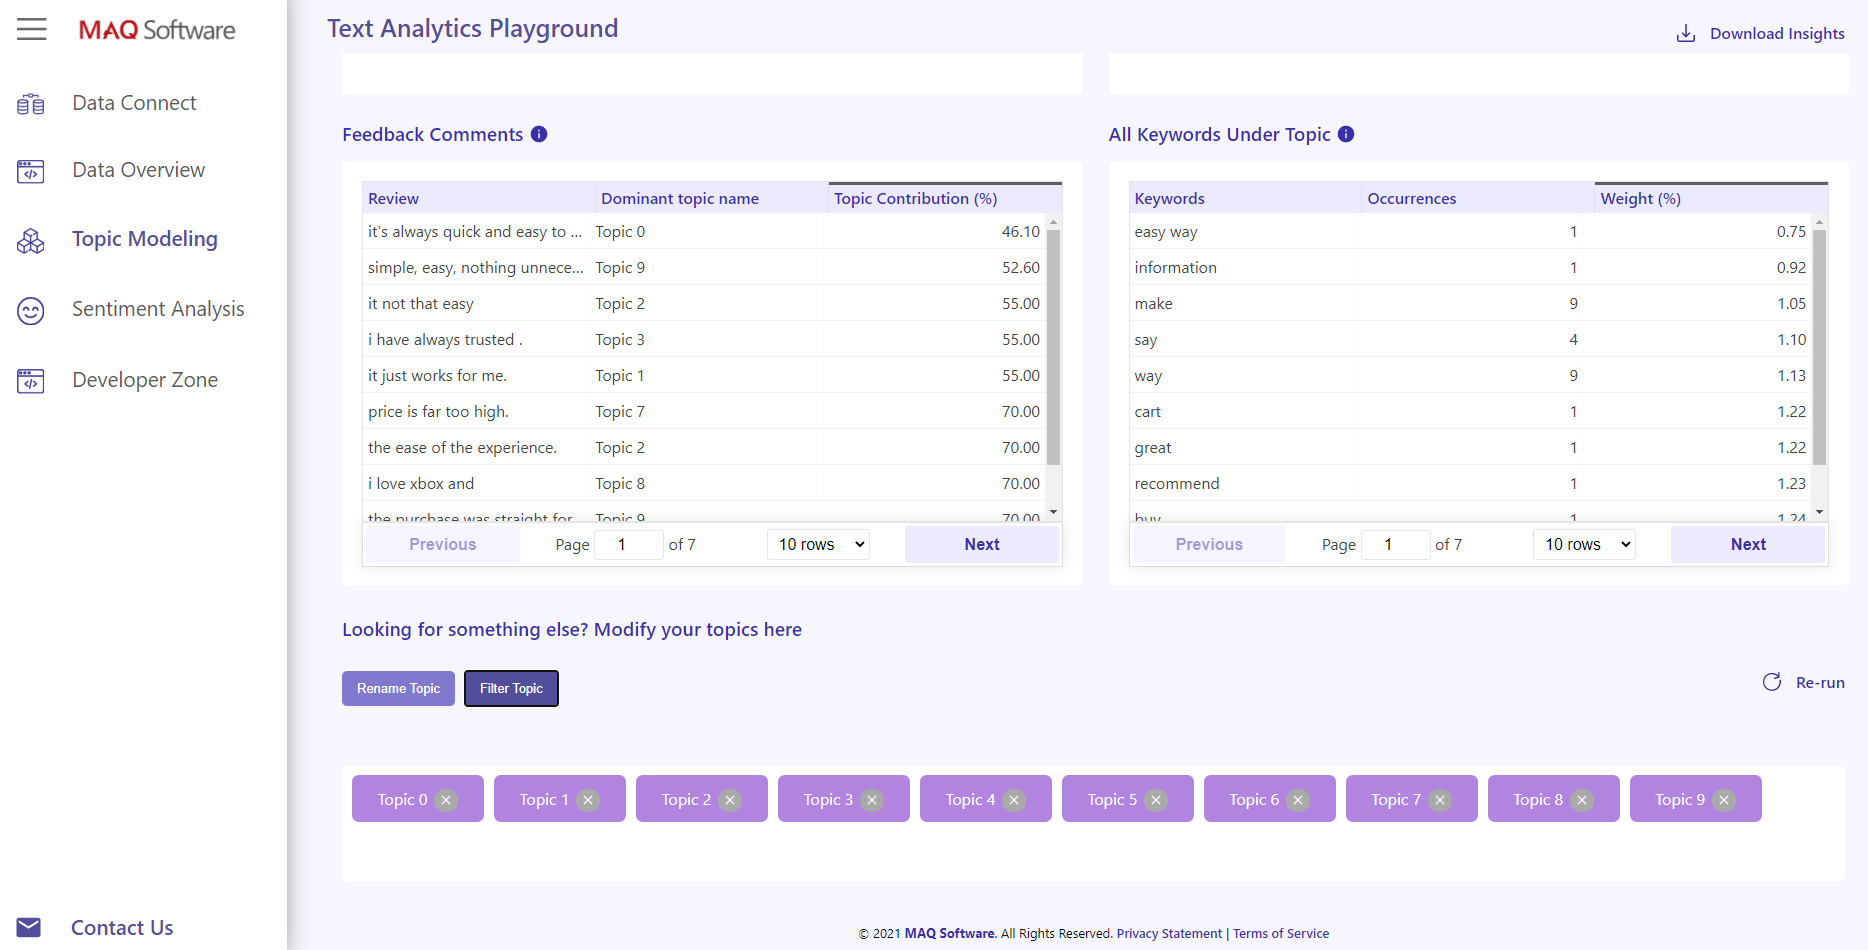
Figure 6: Topic Modeling Page - Filter Topic
Customization & Pricing
The free version of Text Analytics Engine is available here. To discuss customization and pricing, please contact our sales team at CustomerSuccess@MAQSoftware.com