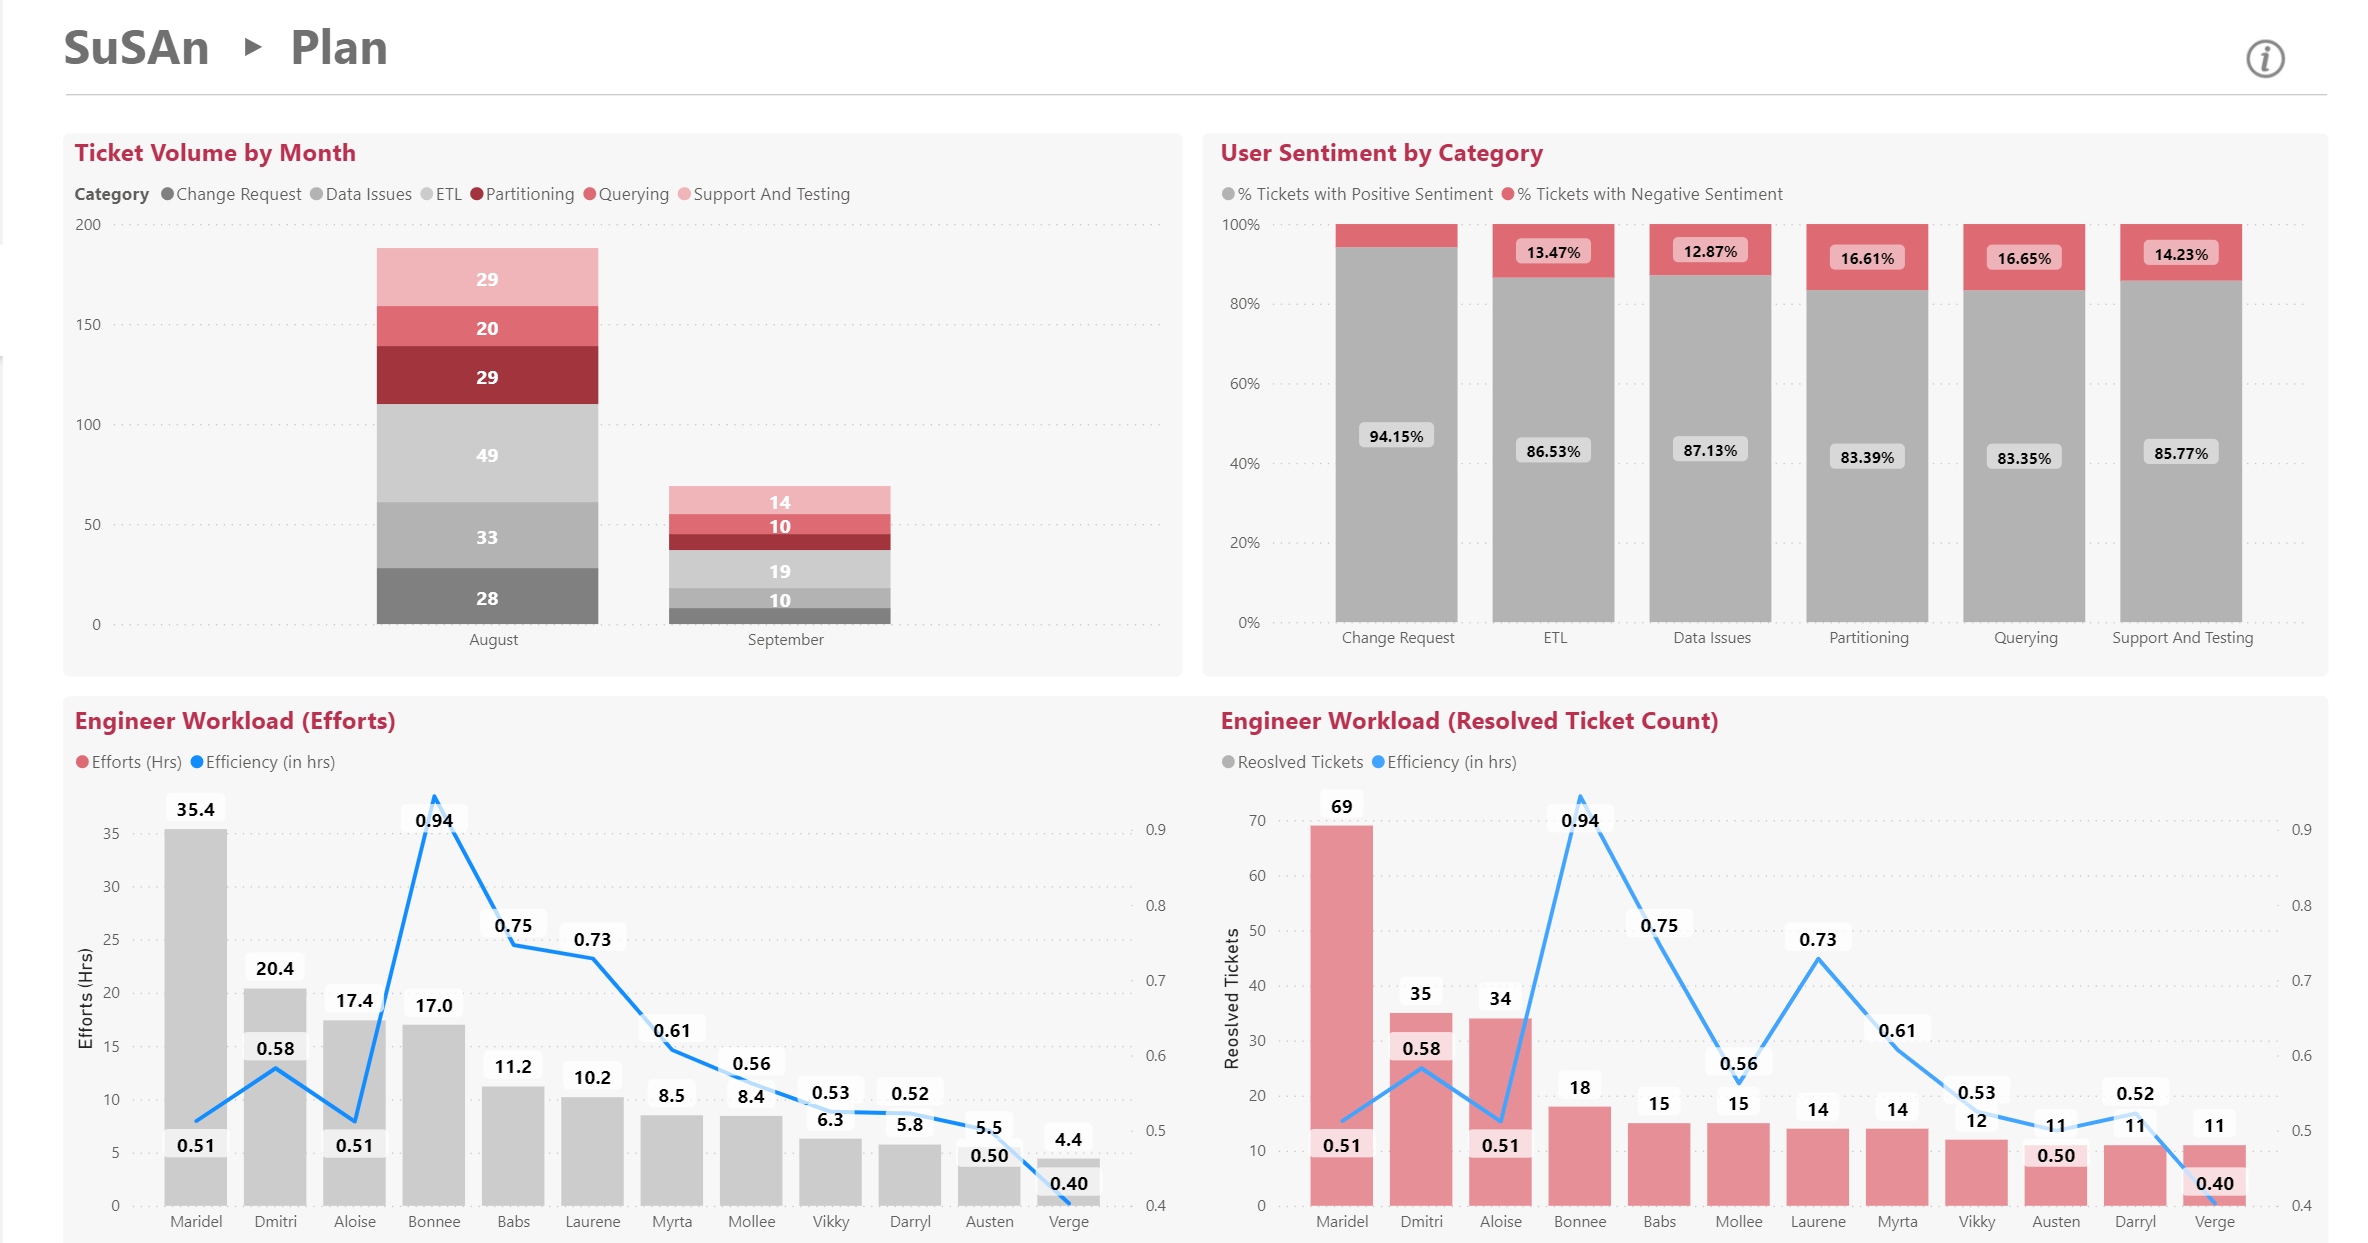
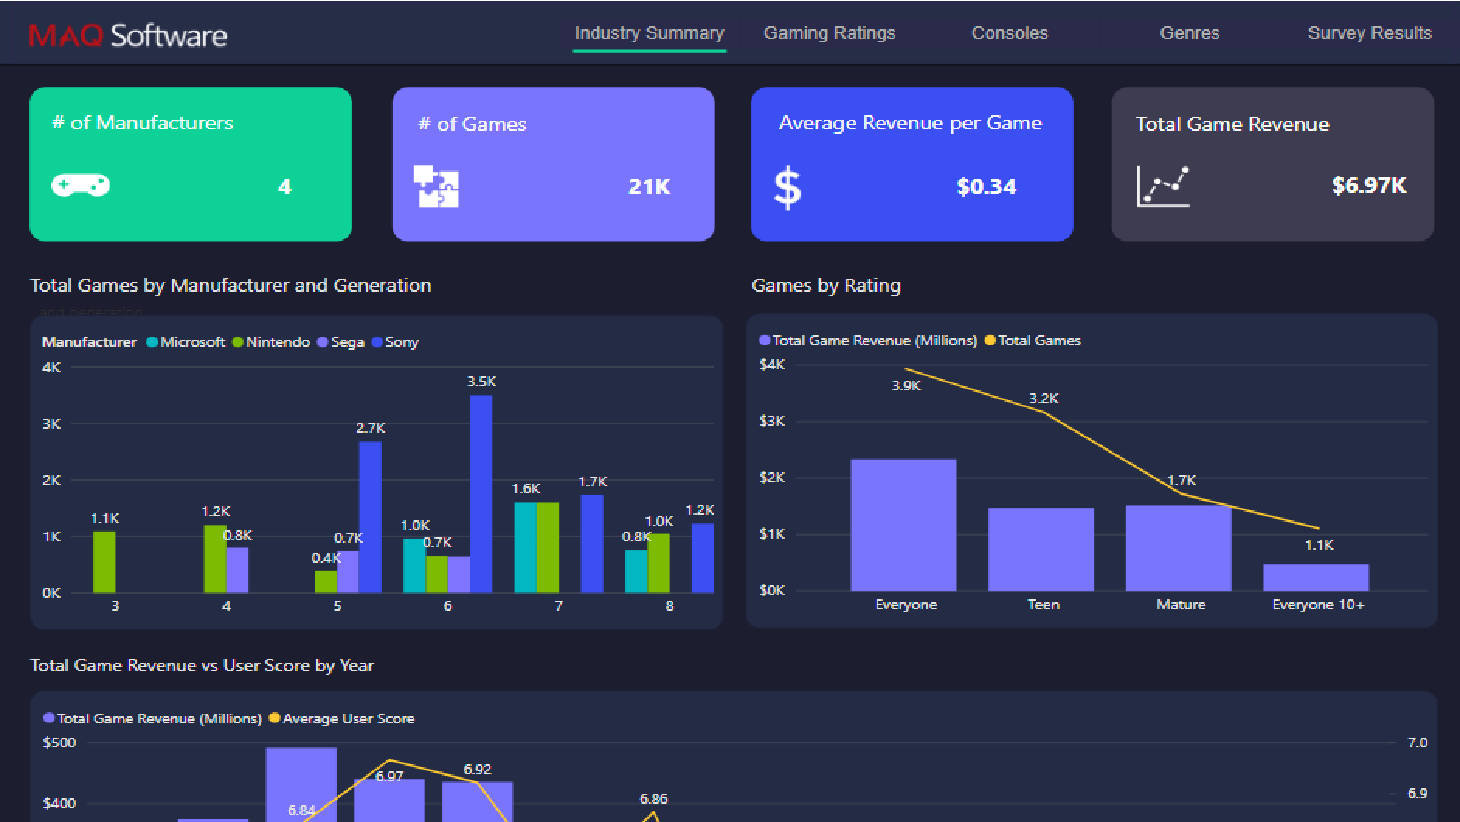
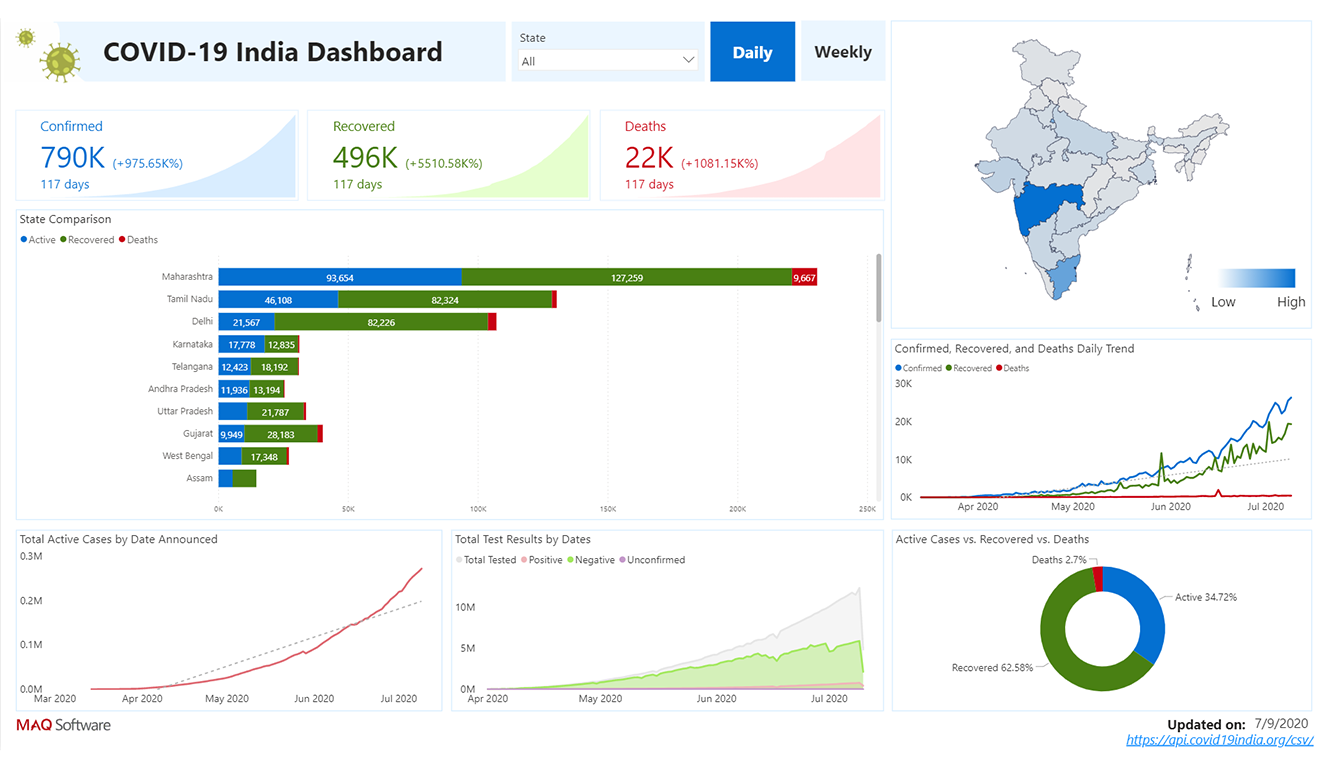
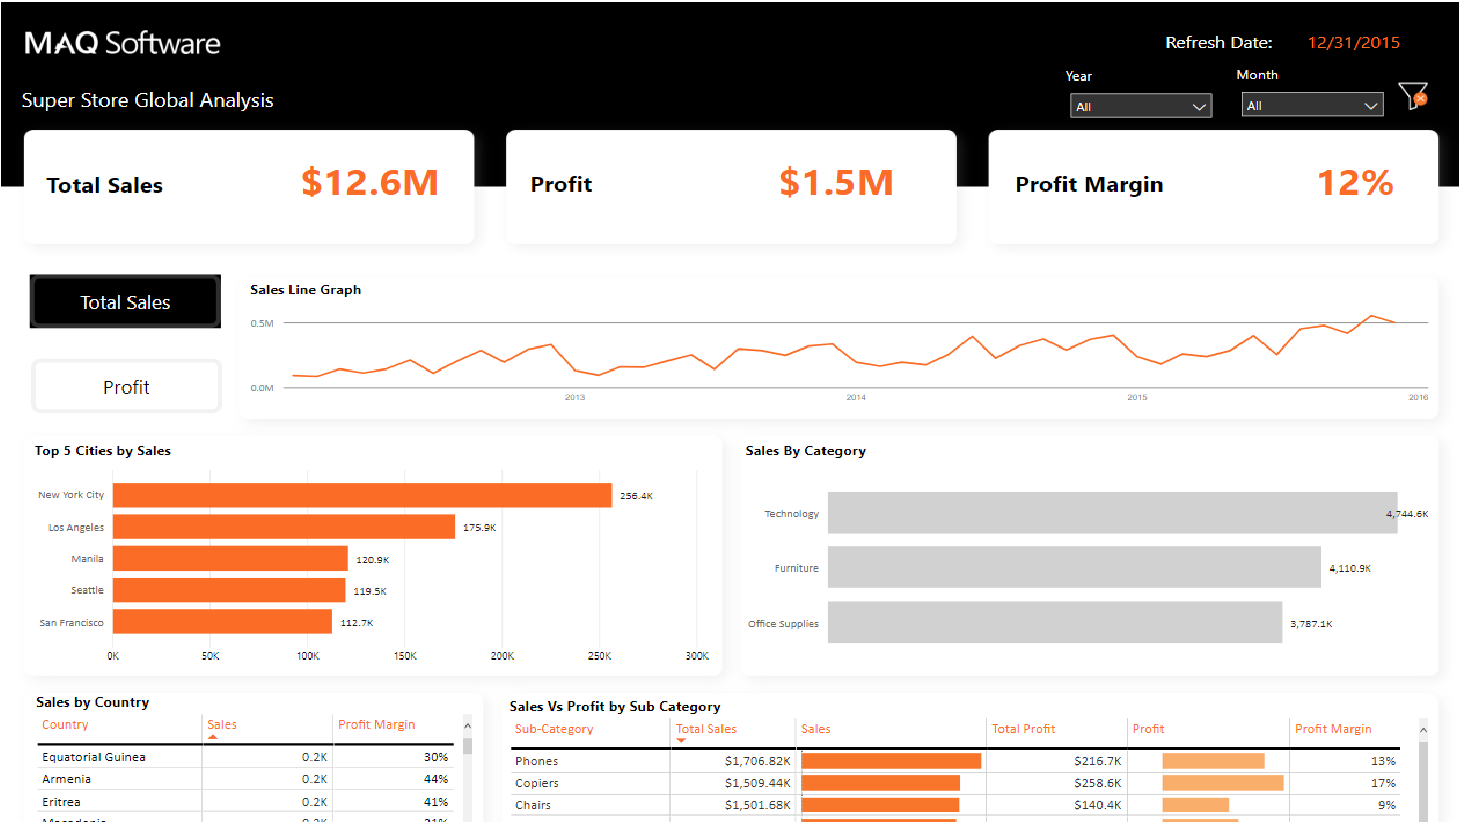
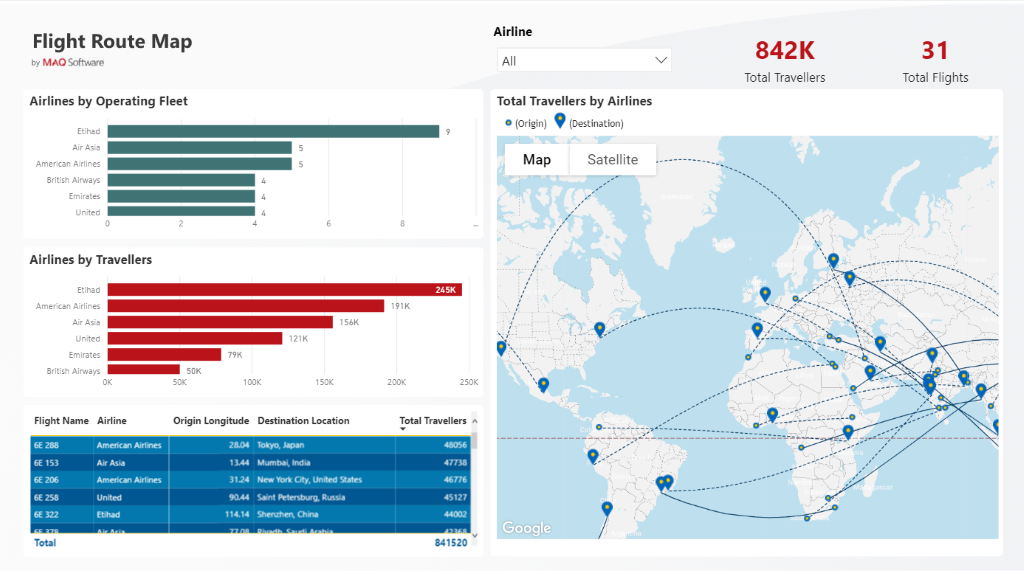
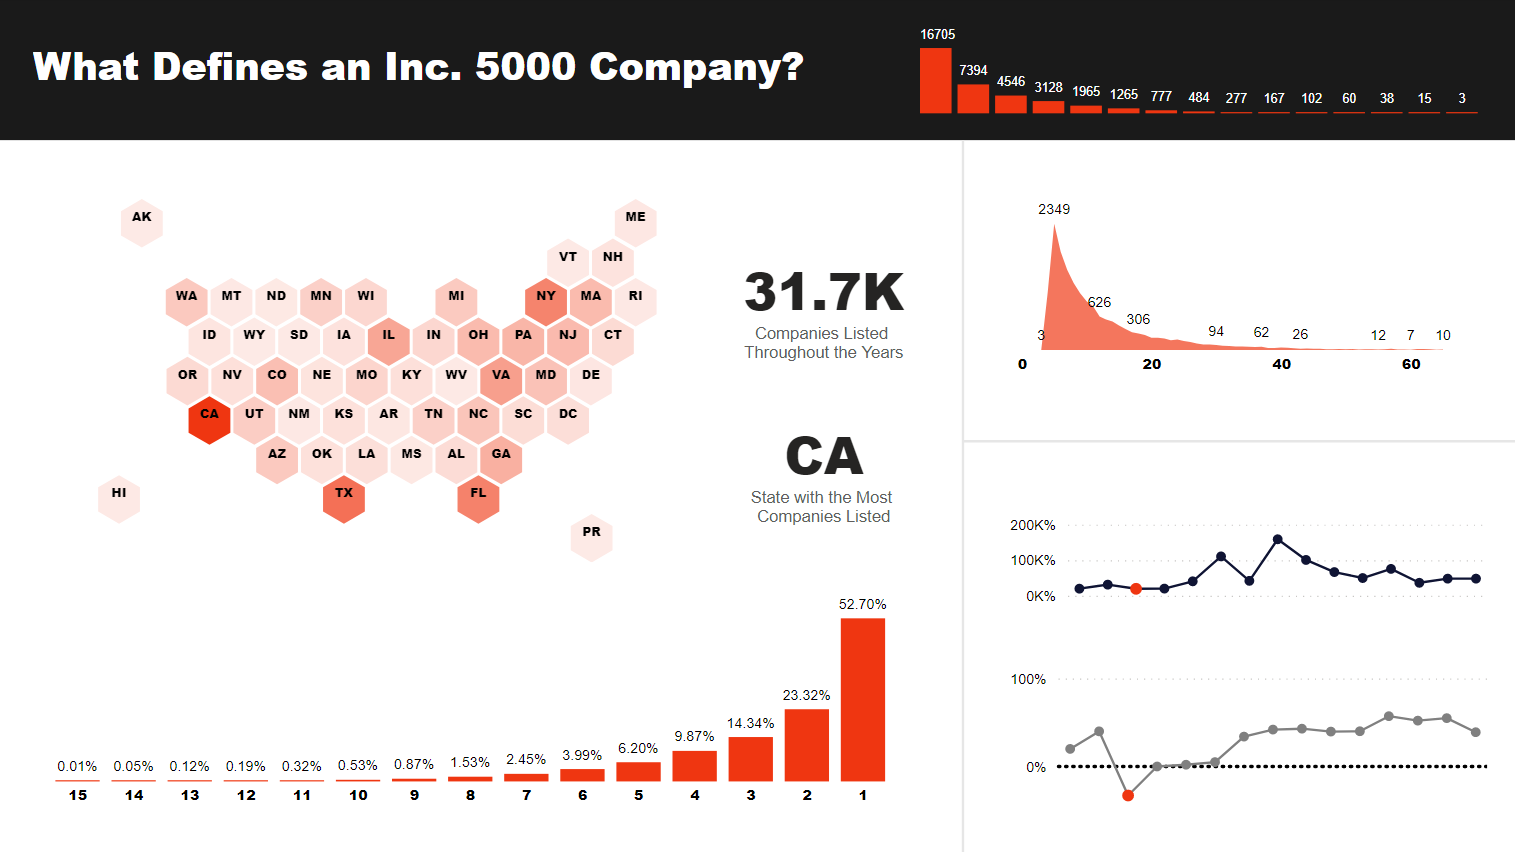
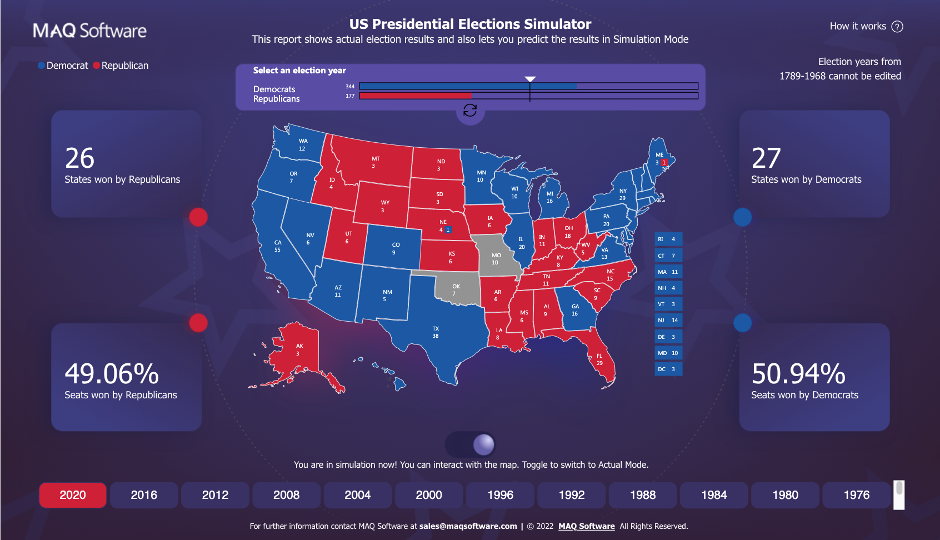
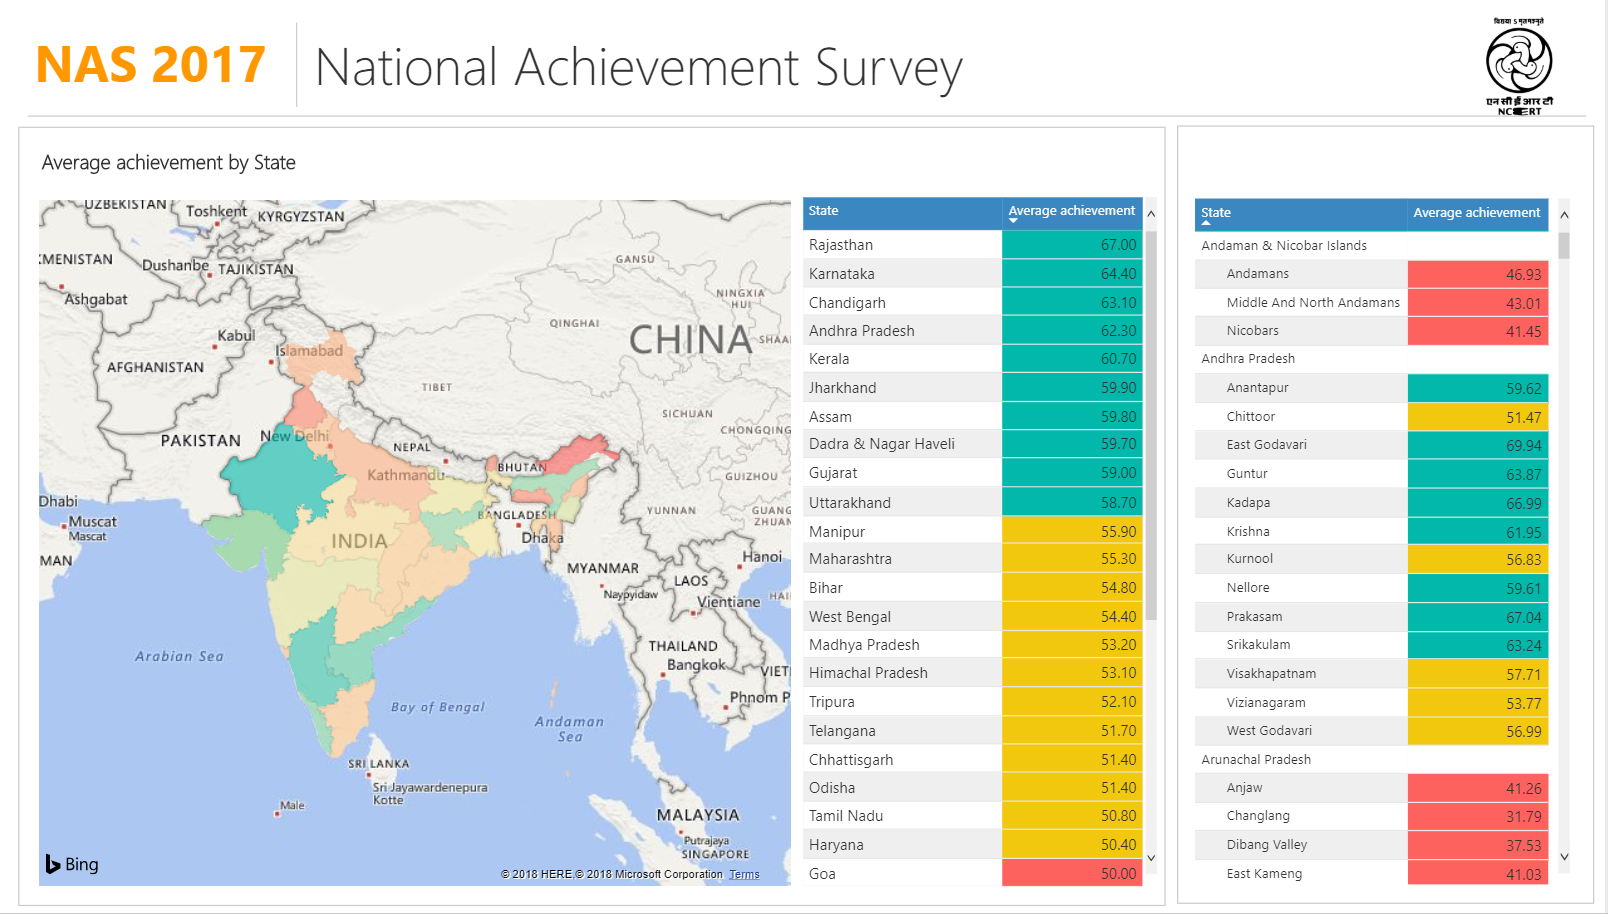
Explore our free Power BI reports to gain insights on election results, COVID-19 impact, Inc. 5000 history, popular gaming trends, retail, travel, and education.
Using machine learning, our support system analytics dashboard (SuSAn) analyzes support tickets for trends, sentiment, workload, and more.
The Console Gaming Competition Analysis Dashboard displays the overall performance of console gaming companies in terms of products and curated features.
The COVID-19 India Dashboard outlines the spread of the virus across the country, highlighting key metrics like total confirmed cases, recovered cases, and deaths.
The Retail Chain Global Sales Dashboard showcases the sales performance and profitability of a global retail chain across its various operating geographies.
The Flight Route Map Dashboard uses an animated map visual to showcase flight details for different airlines originating from source locations to destination locations across the globe.
The Inc. 5000 Report visualizes 11 years of Inc. 5000 data for entrepreneurs to drill down into specifics such as industry, geography, and rank.
The Election Map enables users to view United States historical election results and analyze the electoral college from any touch-screen device.
The Education Insights Report visualizes the literacy and performance data from the Indian National Achievement Survey.