All Power BI custom visuals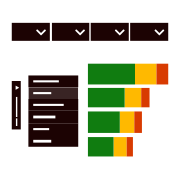
Data Insights
Explore, understand, and interact with data by enabling insights in various forms
Visual at a glance
Category
Comparison
Certification
Power BI Certified
Best used for
Explore, understand, and interact with data by enabling insights in various forms
About Data Insights
Data Insights by MAQ Software allows users to view data in multiple formats and quickly narrow data results. Users can switch between a horizontal bar, vertical bar, brick, or tabular formats. With Data Insights by MAQ Software, users can easily select, view, and explore data in the format that best fits their individual business needs.
Key Feature
- Display data in bar, brick, and tabular formats
- Custom text and background colors
- Tooltips with additional insights
- Data by color and legends
Business uses
- Display multiple sales KPIs simultaneously
- Shift between multiple KPIs or reporting periods by changing the axis base
What's new
- Updated API to v5.11.0, migrated to ESLint, added new formatting pane, and removed deprecated APIs.
Feature walkthrough
MAQ SoftwareData Insights
For a demo video, please visit ourYouTube channelFor technical support, please visit ourPower BI community forum
Contact Us. Thank you for using Data Insights by MAQ Software. Have questions about this or any of our other Power BI custom visuals? For issues, contact Support@MAQSoftware.com. For priority requests or custom builds, contact CustomerSuccess@MAQSoftware.com.