All Power BI custom visuals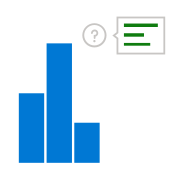
Dynamic Tooltip
Enhance readability of reports by providing additional data points as tooltips | PBI certified
Visual at a glance
Category
Utility
Certification
Power BI Certified
Best used for
Enhance readability of reports by providing additional data points as tooltips | PBI certified
About Dynamic Tooltip
Add visual aids and indication images with Dynamic Tooltip by MAQ Software, such as a glowing bulb icon in the corner of a chart to indicate the tooltip contains 'tips'. While most available tooltips only display static information, Dynamic Tooltip by MAQ Software displays both static text and dynamic text. Dynamic text responds to changes in your data sources. When the data in your data source changes, Dynamic Tooltip automatically updates.
Key Feature
- Static and dynamic options for report charts
- Customized icon image configuration
- Formatting options for decimals and display unit data.
Business uses
- Development Team – Adapt the readability of reports for a wide user base
- Sales & Marketing - Highlight the conversion rate and online engagement, bounce rate and page views, click-through rate and bounce rate, or upselling success rate and cross selling success rate
- Operations - Visualize the relationship between cash-to-cash time cycle and days of inventory, or days of receivables and days of payables.
Feature walkthrough
MAQ SoftwareDynamic Tooltip
For a demo video, please visit ourYouTube channelFor technical support, please visit ourPower BI community forum
Contact Us. Thank you for using Dynamic Tooltip by MAQ Software. Have questions about this or any of our other Power BI custom visuals? For issues, contact Support@MAQSoftware.com. For priority requests or custom builds, contact CustomerSuccess@MAQSoftware.com.