All Power BI custom visuals

Gantt Chart

Easily manage projects with an enhanced Gantt chart | Power BI certified
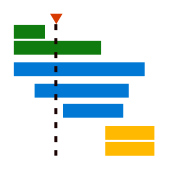
Visual at a glance

Category
Change Over Time
Certification
Power BI Certified
Best used for
Easily manage projects with an enhanced Gantt chart | Power BI certified

About Gantt Chart

Gantt charts enable you to schedule and manage tasks, but traditional Gantt charts only display basic details such as task IDs, task names, and schedules. Gantt Chart by MAQ Software includes a grid where users can include additional task information such as budget, project status, and location. With Gantt Chart, you can access a complete overview of your project or view individual tasks and their progress. You can also group tasks by category or sort for specific data points. For even more capabilities, try Gantt Chart by MAQ Software (Premium). In addition to the capabilities above, you will also have access to the following features: Progress bar – Accepts % values and measure values between 0 and 1; Task status – Accepts categorical values for mapping status flags for each task; Milestones – Accepts up to 5 date fields for showing milestone shapes as per user settings; Configurable bar height – User setting to change height of task rows.

Key benefits

  • Hierarchical view of grouped tasks with an expand/collapse option for each category
  • Colored bars based on task category
  • Grid with expanded task details
  • Task status in relation to the current date
  • Sort data by any grid detail
  • Tooltips for column headers, category labels, KPI indicators, data labels, and bars
  • Support for date formatting
  • Support for context menu
  • (PREMIUM) Progress bar
  • (PREMIUM) Task status
  • (PREMIUM) Milestones
  • (PREMIUM) Category limit increased to 10 (in the Basic version, a maximum of 4 categories can be used)
  • (PREMIUM) Configurable bar height

Use cases

  • Project managers: Monitor project IDs, start times, end times, status, duration, project owners, task priorities, and other relevant KPIs
  • Sales and marketing: Schedule a campaign while tracking for budget, team input, and sales metrics
  • Admin: Break down company-wide tasks into manageable sprints that measure for success criteria such as completion date and risk status

What's new

  • Added toggle for changing sort behavior – Independent sort
View full details

Feature walkthrough

MAQ SoftwareGantt Chart
For a demo video, please visit ourYouTube channelFor technical support, please visit ourPower BI community forum

Contact Us. Thank you for using Gantt Chart by MAQ Software. Have questions about this or any of our other Power BI custom visuals? For issues, contact Support@MAQSoftware.com. For priority requests or custom builds, contact CustomerSuccess@MAQSoftware.com.

FAQs

What is the Gantt Chart visual used for?

The Gantt Chart visual helps organizations manage project schedules, tasks, milestones, and deadlines. It also provides a grid for displaying additional task information such as budget, status, location, and other KPIs.

What data fields are required?

Typical fields include Task Name, Start Date, End Date, Duration, Status, and Category. Additional KPI fields can also be displayed.

Can I customize the appearance of the Gantt Chart?

Yes. You can customize:

  • Task bar colors
  • Category colors
  • Grid settings
  • Labels
  • Tooltips
  • Grouping options
Does the visual support task hierarchies?

Yes. The visual provides hierarchical task grouping with expand and collapse functionality for each category.

Can tasks be grouped into categories?

Yes. Tasks can be grouped by project phase, department, team, priority, or any other business category.

Can I view additional task details?

Yes. The built-in grid can display budget, status, location, owner, priority, duration, and additional KPI information.

Can users sort data within the visual?

Yes. Users can sort using any available grid column to focus on relevant project information.

Does the visual show task status relative to the current date?

Yes. The visual helps identify ongoing, completed, upcoming, or delayed tasks based on the current date.

What tooltip capabilities are available?

Tooltips are available for column headers, category labels, KPI indicators, data labels, and task bars.

Which business scenarios is this visual best suited for?

Common use cases include:

  • Project Management
  • Sales and Marketing Campaign Planning
  • Administrative Project Tracking
  • Sprint Planning
  • Operations and Resource Scheduling
What are the key features of Gantt Chart?

Key features include:

  • Hierarchical task grouping
  • Expand/collapse categories
  • Color-coded task bars
  • Detailed task information grid
  • Sorting capabilities
  • Advanced tooltip support
  • KPI tracking
Is the Gantt Chart visual responsive?

Yes. The visual adapts to different dashboard layouts and report sizes.

Can I try the Gantt Chart Visual before I buy it?

Yes. You can evaluate the visual through Microsoft AppSource before purchasing.

Can I get an estimate/quote?

Further inquiries regarding pricing can be directed to customersuccess@maqsoftware.com.

Is Gantt Chart certified by Microsoft?

Yes. Gantt Chart is a certified Power BI custom visual.

Where can I report issues or request new features?

For support, bug reports, or feature requests, contact customersuccess@maqsoftware.com.

Related visuals

Change Over Time

Trading Chart

View visual