All Power BI custom visuals
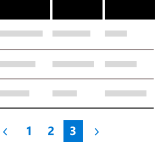
Grid

Navigate large data sets with ease by showcasing data in a paginated grid format that can be sorted

Visual at a glance

Category
Ranking
Certification
Power BI Certified
Best used for
Navigate large data sets with ease by showcasing data in a paginated grid format that can be sorted

About Grid

Navigate large data sets to focus on the most important items. Grid by MAQ Software allows users to present specific data from a complex data set. The visual's capabilities include pagination, which facilitates easy navigation. The visual also has a sort function, which allows users to sort data based on any column.

Key Feature

  • Support for image URLs
  • Support for multiple data formats including CSV
  • Support for special characters

Business uses

  • Upper Management: Navigate Power BI reports for key data while retaining the necessary context
  • Sales: Sort through global data across multiple geographies and demographics
  • Customer support: Easily track specific products, features, customers, and support tickets

What's new

  • Added support for the context menu
View full details

Feature walkthrough

MAQ SoftwareGrid
For a demo video, please visit ourYouTube channelFor technical support, please visit ourPower BI community forum

Contact Us. Thank you for using Grid by MAQ Software. Have questions about this or any of our other Power BI custom visuals? For issues, contact Support@MAQSoftware.com. For priority requests or custom builds, contact CustomerSuccess@MAQSoftware.com.


FAQs

What is the Grid visual used for?

The Grid visual helps users navigate large datasets by displaying information in a paginated, sortable grid format. It enables users to focus on important information while retaining necessary context from the dataset.

What data fields are required?

The visual requires one or more columns of data to display records in a tabular grid format. Data can be presented and organized based on the selected fields.

Can I sort data within the visual?

Yes. The Grid visual includes sorting capabilities that allow users to sort records based on any displayed column.

Why should I use Grid instead of a standard table visual?

Grid provides pagination and advanced navigation capabilities, making it easier to work with large datasets without overcrowding the report page.

How does Grid improve the reporting experience?

Grid makes large datasets easier to explore by combining structured tabular presentation, pagination, sorting, and support for multiple data formats in a single visual.

Which data formats are supported?

The Grid visual supports multiple data formats, including CSV and other commonly used tabular data formats.

Does the visual support special characters?

Yes. The visual supports special characters, making it suitable for displaying diverse datasets and multilingual content.

Which business scenarios is this visual best suited for?

The Grid visual is commonly used for:

  • Executive and management reporting
  • Sales analysis across regions and demographics
  • Customer support ticket tracking
  • Product and feature monitoring
  • Large dataset exploration and navigation
Can I use the visual to explore large datasets?

Yes. The combination of pagination and sorting makes the visual suitable for exploring and analyzing large volumes of data.

Is Grid responsive?

Yes. The visual adapts to different report layouts and sizes, allowing users to view tabular information effectively across report pages.

Is Grid certified by Microsoft?

Yes. Grid is a Microsoft-certified Power BI custom visual.

Where can I report issues or request new features?

For support, bug reports, or feature requests, contact customersuccess@maqsoftware.com. MAQ Software regularly reviews customer feedback and incorporates enhancements into future releases.

Related visuals

Ranking, KPI

KPI Grid

View visual
Ranking

Ratings

View visual
