All Power BI custom visuals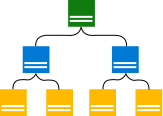
Hierarchy Chart
Streamline your organizational insights | Power BI Certified
Visual at a glance
Category
Distribution
Certification
Power BI Certified
Best used for
Streamline your organizational insights | Power BI Certified
About Hierarchy Chart
Discover the power of visual hierarchy to depict relationships within any organizational, departmental, or functional area. Hierarchy Chart by MAQ Software transforms complex structures into intuitive, top-down structured tree diagrams. Incorporate images to bring your data to life, offering a clear, visual representation of various entities and their connections.
Key Feature
- Customizable appearance: Modify connector links, card dimensions, borders, and corner radius for a personalized look.
- Color coding: Assign colors based on the Legend column to signify different statuses or categories.
- Interactive cards: Expand/collapse levels and cross-filter other visuals to explore your data.
- Navigational freedom: Zoom and drag features allow for adaptable visualization positioning.
Business uses
- Sales: Analyze sales performance by territory or target achievement, using color-coding for clarity.
- Human Resources: Organize your workforce by department and rank, improving clarity and planning efficiency.
- IT management: Catalogue IT assets by category and quantity, providing a comprehensive overview of resources.
- Operations: Visualize manufacturing processes or product components in detailed hierarchical formats.
- Finance: Illustrate budget distributions across divisions or projects, using color coding to identify areas on or off track.
What's new
- Fixed node overlapping issues in the hierarchy layout.
- Fixed node selection behavior.
- Fixed bookmark support.
- Fixed highlight interaction.
- Fixed reporting tooltip issues.
- Updated project dependencies and development packages.
Feature walkthrough
MAQ SoftwareHierarchy Chart
For a demo video, please visit ourYouTube channelFor technical support, please visit ourPower BI community forum
Contact Us. Thank you for using Hierarchy Chart by MAQ Software. Have questions about this or any of our other Power BI custom visuals? For issues, contact Support@MAQSoftware.com. For priority requests or custom builds, contact CustomerSuccess@MAQSoftware.com.