All Power BI custom visuals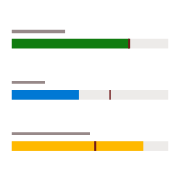
Linear Gauge
Compare progress against identified goals and warning zones | Power BI certified
Visual at a glance
Category
Comparison
Certification
Power BI Certified
Best used for
Compare progress against identified goals and warning zones | Power BI certified
About Linear Gauge
Setting targets up front and working towards them over a period is common across all industries. Linear Gauge by MAQ Software shows the progress toward a target value, such as achieved sales versus targeted monthly sales. Users can include multiple data points which illustrate trends such as monthly or year-to-date (YTD) completion rates. The visual displays the present value, percentage toward completion, and two optional trend values.
Key benefits
- Customizable minimum and maximum metric value
- Customizable gauge and data label colors
- Six-unit options for the metric
- Gradient background color highlighting the percentage progress
- Hierarchy feature (using drill-down to display different levels of data)
- Animation effect that displays current progress on visual load
- Target value marker
- Zoom in and hover feature for target line and marker
- Separate tooltip for each category
- Option to change the target label position
- Bookmarks supported
- Ability to change color when the target value is equal to the actual value
- Support to display values in the given locale
- Limit on font sizes
Use cases
- Financial services: Track budget consumption against allocated budgets for the year or quarter
- Sales: Track daily or weekly progress against sales goals for the quarter
- Marketing: Track progress on impressions, views, and clickthrough against the marketing campaign targets
- Operations: Track daily output against daily or weekly goals
Feature walkthrough
MAQ SoftwareLinear Gauge
For a demo video, please visit ourYouTube channelFor technical support, please visit ourPower BI community forum
Contact Us. Thank you for using Linear Gauge by MAQ Software. Have questions about this or any of our other Power BI custom visuals? For issues, contact Support@MAQSoftware.com. For priority requests or custom builds, contact CustomerSuccess@MAQSoftware.com.