All Power BI custom visuals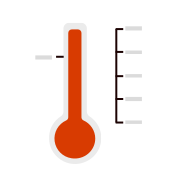
Thermometer
Represent progress toward goals | PBI certified
Visual at a glance
Category
Single Metric
Certification
Power BI Certified
Best used for
Represent progress toward goals | PBI certified
About Thermometer
Visualize your progress towards a target goal with Thermometer by MAQ Software. This visual offers you at-a-glance insights into your KPIs.
Key Feature
- Customizable fill and border color
- Editable minimum and maximum values (of the scale)
- The tick bar can be turned off for a minimalist look
Business uses
- Manufacturing - Track inventory levels, throughput, rate of return, maintenance costs, uptime, average delivery time, and average number of shipments
- Human Resources - Track average attendance, employee turnover, and employee satisfaction
Feature walkthrough
MAQ SoftwareThermometer
For a demo video, please visit ourYouTube channelFor technical support, please visit ourPower BI community forum
Contact Us. Thank you for using Thermometer by MAQ Software. Have questions about this or any of our other Power BI custom visuals? For issues, contact Support@MAQSoftware.com. For priority requests or custom builds, contact CustomerSuccess@MAQSoftware.com.